

News
Bringing Experimentation to the Ad Context Protocol
How AI is helping humans shape an open protocol for agentic advertising

Over the past few weeks, I have had a close look at how agentic advertising may develop. I recently completed the Basics certification for the Ad Context Protocol (AdCP), an emerging open protocol for AI agents buying and selling advertising. In the course of the certification, the AI instructor prompted me to post some of my questions as GitHub issues, which led to public exchanges with Brian O'Kelley, Evgeny Popov and Nathan Woodman.
I expected to learn about a promising technical standard. I did not expect the certification itself to show me how differently professional education and standards development may work in the age of AI.
That broader context is becoming hard to ignore. Google, Meta and Amazon are pouring AI into ad matching, creative and campaign automation. Agencies are applying it to operational efficiency. Time has begun serving ads to bots. Working with Mobian, the new venture from Moat co-founder Jonah Goodhart, Time is embedding sponsored brand information in machine-readable articles to influence the answers AI assistants give people. Oracle acquired Goodhart’s previous company for a reported $850 million in 2017.
We are moving toward advertising created with machines, bought and sold by machines and, in some cases, delivered to machines to influence the advice they give people. AdCP addresses part of the infrastructure this will require.
What AdCP is designed to do
AdCP is not another version of OpenRTB, which governs auctions for individual impressions. It sits above that transaction layer, giving buyer and seller agents a common language for conducting business. They can use it to discover inventory, negotiate proposals, manage creative and exchange reporting. It makes the insertion order machine-readable.
Agents cannot efficiently negotiate across a fragmented market if each buyer requires a separate integration with each seller. A shared protocol could also help them discover and evaluate newer products such as Time’s agent-readable sponsored content. The details will change, but the need for machine-readable descriptions and transaction rules seems clear.
AdCP did not begin as a conventional standards initiative. Brian O’Kelley, a veteran ad-tech entrepreneur who helped build Right Media, AppNexus, Prebid and Scope3, joined with other practitioners to develop an open solution to a need they saw emerging before the industry had settled on a formal standard.
Learning the protocol through AI
The certification followed the same open, iterative spirit. Instead of videos, slide decks and a multiple-choice test, I learned all about the protocol through a conversation with an AI assistant called Addie. Once Addie discovered that I had worked at DoubleClick, Google and Viant during the formative years of programmatic advertising, it stopped explaining RTB basics and engaged me on the architecture. It answered questions, acknowledged uncertainty and periodically tested my understanding.
At one point I found myself thinking, “AI gets me.” The system did not merely adjust the pace of a fixed course. It drew on my professional background and current interests, and the conversation soon went beyond the course material. Before long, I was contributing ideas to the project itself. The project leaders had built an effective certification course around an LLM chatbot, something I had never encountered before.
Bringing experimentation to AdCP
My work focuses on incrementality measurement and randomized experiments. As Addie and I discussed the protocol, I began asking how an agentic media-buying system would support experimentation, including geographic treatment and holdout groups, seller commitments not to deliver in excluded markets, geo-level reporting, and tests involving Sponsored Intelligence. To my surprise, Addie drafted four GitHub issues from our conversations during the certification course. I posted them, and Brian responded to all four soon afterward.
Brian clarified that AdCP already supported binding DMA inclusions and exclusions and showed exactly how they could be used to create geographic treatment and holdout groups. But the discussion surfaced a broader limitation: DMAs are U.S.-specific and too coarse for many experiments. Evgeny Popov, a founding member of AdCP and Global Head of Enterprise at Samba TV, subsequently proposed extending the same mechanism to global cell systems such as H3. Nate Woodman, an ad-tech veteran and founder of Proof in Data who has developed a spatial-temporal framework for cross-channel advertising measurement, helped refine how those cells should represent the uncertainty surrounding a location. The resulting approach could allow buyers and sellers anywhere to define treatment and holdout areas at an appropriate scale, enforce the same boundaries and match advertising exposure with geographic sales outcomes.
I came away with a genuine sense of accomplishment. I had brought my experience designing advertising experiments to an emerging protocol, and Brian, Ev and Nate engaged directly with my ideas. Our exchanges produced a concrete proposal to improve how AdCP supports geographic experiments. In previous efforts to influence industry protocols through top-down, committee-driven processes, my suggestions had simply been ignored. Here, the open development process gave my subject-matter expertise a genuine opportunity to shape the protocol.
Where AdCP fits in agentic advertising
AdCP is not the only effort shaping agentic advertising. IAB Tech Lab’s Agentic Advertising Management Protocols, or AAMP, builds agent workflows on existing standards such as OpenDirect, AdCOM and the Deals API. Its buyer and seller agents address some of the same management-layer functions as AdCP, including discovery, negotiation, ordering and reporting.
The IAB's Agentic Real-Time Framework, or ARTF, addresses a different layer. It allows an advertiser’s own decisioning model to run inside a host advertising platform at auction speed. Adam Heimlich, CEO of Chalice AI, compares this to the rise of hedge funds and quantitative trading firms, which developed proprietary algorithms rather than relying on brokers to decide what assets were worth. ARTF could give large advertisers a similar capability: they could use shared market infrastructure while retaining control of the models that determine what impressions are worth to them. In a recent pilot, Hyundai used a Chalice model deployed inside OpenX to make CTV bidding decisions for three vehicle models and is now extending the approach across its fleet.
AdCP and AAMP govern communication and transaction management among agents. ARTF brings an advertiser’s own decisioning into the auction itself. An advertiser might eventually use agents to discover and negotiate inventory, then apply its own value model when impressions become available.
These efforts also point toward greater advertiser control. Faster automated decisions are not necessarily better decisions, particularly when the platform still defines what the system is optimizing. Platform optimization reflects the platform’s data, incentives and definition of value. With ARTF, the advertiser can own the model that decides what an opportunity is worth. Open transaction protocols could allow buyers and sellers to interact through shared rules rather than remain confined within one platform’s interface and logic.
Sponsored Intelligence extends the idea further. It anticipates brands supplying structured information or sponsored responses inside AI conversations. The precise business model may change, but the need is already apparent. As AI assistants mediate more discovery and purchase decisions, advertisers will need ways to make offers and claims legible to machines while preserving disclosure, governance and measurement.
What I took away from the experience
The AdCP certification was not perfect. The assistant timed out, daily conversation limits interrupted the process, and one session ended just before it was supposed to issue the certification. But those problems were less memorable than the process itself. I enrolled to learn about AdCP. By the end, several of my questions had entered its public development process, where more experienced contributors corrected and extended them.
I do not know whether AdCP will become the dominant protocol for agentic advertising, or how it will ultimately relate to AAMP and other initiatives. But the problems it addresses are real. My experience showed me an emerging standard being developed in public, through practical use, with AI helping more people participate.
The future of advertising will not be one protocol or model. It will be an expanding system of agents creating, negotiating, buying, optimizing and sometimes consuming advertising. My first experience with AdCP made that future feel considerably less abstract.
The Benchmark Advertising Still Needs
I recently came across a study, Meta-Analysis of Advertising Effectiveness: New Insights from Improved Bias Corrections, by Joseph Korkames, et al. It arrives at an average short-term advertising-to-sales elasticity of 0.0008, a figure statistically indistinguishable from zero.
I found it through a LinkedIn post by a marketing consultant who summarized the finding this way: How much can we expect sales to increase if we significantly increase advertising? His answer was “close to zero.”
That is a fair shorthand for the headline estimate, but it leaves unclear what the number represents. Advertising elasticity measures the marginal effect of changing spending, typically within an existing advertising program. An elasticity of 0.0008 means that a 10% increase in advertising spending is associated with a 0.008% increase in sales. For a company with $10 billion in sales and a $1 billion advertising budget, another $100 million in advertising would produce just $800,000 in additional short-term revenue.
Without that context, the finding can easily be mistaken for evidence that advertising itself has virtually no effect. But it concerns dollars added to an existing program, where diminishing returns may already have set in. It does not tell us advertising’s total contribution to sales, the value of the first dollars spent, what would happen if an established brand stopped advertising, or whether advertising “works.”
The study effectively updates research summarized in Dominique Hanssens’s influential Empirical Generalizations About Marketing Impact. That work included the well-known study How Well Does Advertising Work? Generalizations from Meta-Analysis of Brand Advertising Elasticities, which produced an average elasticity of approximately 0.12. Applied to the same hypothetical company, a 10% increase in spending would generate $120 million in additional sales, rather than $800,000.
The newer study uses more recent methods to correct for publication bias, a real and important problem. But its estimate is not a direct observation of advertising’s effect. It is one model applied to estimates produced largely by other models, spanning different products, media, markets, periods and definitions. It requires assumptions about which findings are comparable, how they should be weighted and how publication bias should be corrected.
The enormous difference between 0.12 and 0.0008 may tell us less about advertising than about the difficulty of constructing universal benchmarks from an inconsistent body of research.
I was reminded of a lecture I recently attended by Aaron Brown, a financial and risk-management expert, about his book Wrong Number. Brown examines how the media, politicians and others become captivated by surprising statistics even when the underlying science is dubious. A striking number travels much farther than the qualifications needed to interpret it.
As Twyman’s Law puts it, any figure that looks particularly interesting or different is usually wrong.
Marketing has no shortage of such numbers. A campaign produced a 500% return. Long-term advertising is many times more powerful than short-term advertising. Advertising’s short-term effect rounds to zero.
The trouble begins when the number becomes detached from the method that produced it.
Science, to its credit, has begun some serious house-cleaning. The replication crisis has exposed p-hacking, HARKing, selective reporting, publication bias and irreproducible findings. Journals have retracted prominent studies. Researchers increasingly preregister hypotheses, share data, report null findings and distinguish exploratory analysis from confirmatory testing.
Marketing should pay attention.
About a decade ago, I watched a celebrated marketing thought leader present general principles derived from a database of advertising-effectiveness award winners. He was a gifted showman, thanks in part to freely swearing like a sailor, and the audience loved him.
I could not get past the evidence.
These were campaigns considered unusually successful by the organizations entering them, supported by whichever measurement methods were available, and then selected by judges as worthy of recognition. The cases might offer useful lessons about successful campaigns. Treating them as representative norms for advertising generally did not pass the sniff test.
Around the same time, I was invited to outline a research roadmap for one of the advertising industry’s leading trade organizations. My central recommendation was a living database of advertising-effectiveness results.
Advertisers, publishers, agencies and measurement vendors would contribute anonymized campaign results on an ongoing basis, with participation tied to membership benefits. The database would include winners, losers and inconclusive findings, reducing the publication bias created when only impressive results are shared.
Ideally, APIs into measurement platforms would automate submissions, regardless of whether the outcome was high, low or nonexistent. Identifying information would be removed, and findings would be released only in rule-based aggregate form.
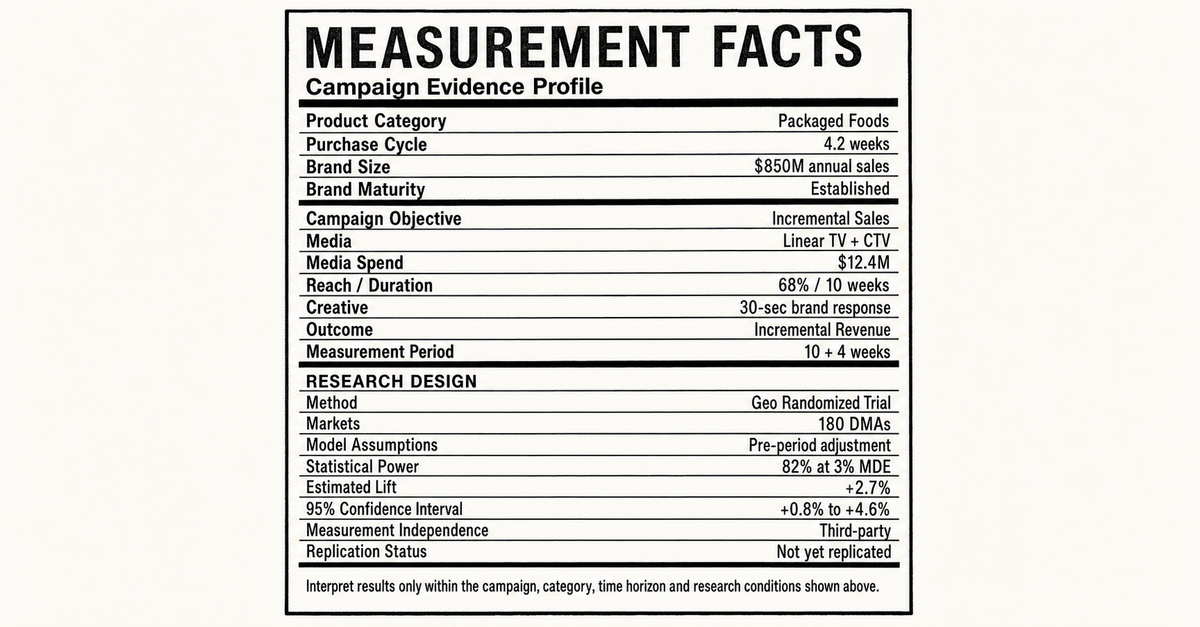
Every result would carry the equivalent of a methodological nutrition label describing:
Product category, purchase cycle, brand size and maturity
Campaign objective, media, spending, reach and duration
Creative characteristics
Outcome measured and measurement period
Research design, model assumptions, statistical power and uncertainty
Independence of the measurement
Most importantly, dissimilar forms of evidence would not be silently blended. Randomized experiments, quasi-experiments, marketing mix models, attribution studies and brand-lift surveys would be classified separately. Incremental sales would be distinguished from attributed sales, causal effects from associations, observed outcomes from modeled estimates, and immediate response from assumed long-term carryover.
Had the industry built this resource a decade ago, we might know considerably more today about what advertising accomplishes. We could examine not only how effectiveness varies across categories, brands and campaigns, but how reported effectiveness varies according to the method used to measure it.
Several standardization efforts are now advancing across advertising, including AdCP, ARTF, IAB taxonomies, DASH, W3C Attribution and initiatives to validate and benchmark MMM. Each addresses a worthwhile part of the problem. A shared framework for classifying evidence would make them more useful by providing a common language for describing what was measured, how it was measured and how much confidence the result deserves.
It would also address the problem I raised in my essay on enterprise AI and marketing effectiveness: garbage in, garbage out. AI systems will absorb decades of MMM outputs, attribution reports, brand-lift studies, award cases and experimental results as though they form a coherent body of knowledge. Without methodological context, AI cannot reliably distinguish causal evidence from favorable correlation. The next generation of automated, AI-powered media planning and buying systems will then use that deeply flawed body of evidence to make optimization decisions, perpetuating past measurement errors at machine speed and scale.
Advertising does not need another universal number. Cookies and cars should not share one response benchmark. Neither should new brands and household names, strong creative and weak creative, or a short promotion and decades of sustained brand building.
We need the infrastructure to answer a more useful question: What kinds of advertising work, for which brands and products, under what conditions, over what period, according to which methods, and with what degree of confidence?
We have accumulated decades of findings. We still have not organized them well enough to know which ones deserve our trust.
Timeless Truths About Advertising, Part III
How We Know Advertising Worked
In the first two essays in this series, I argued that advertising follows remarkably consistent patterns. Reach usually beats frequency. Advertising builds memory that fades over time. Brands grow by reaching more buyers, and every buying occasion represents a new opportunity to compete.
Understanding those patterns is only half the challenge. Marketing doesn't have a measurement problem. It has a decision problem. The industry has no shortage of metrics, models, dashboards, and reports. What marketers, CFOs, and CEOs need is evidence they can trust when deciding where to invest the next advertising dollar. The ultimate purpose of measurement isn't to produce reports. It's to improve decisions.
That raises perhaps the most important question in advertising: How do we know whether advertising actually caused incremental sales? The enduring truths that follow are about separating evidence that guides better decisions from evidence that merely describes what happened.
1. Correlation does not imply causation
The purpose of advertising is simple: to cause more people to buy your product than otherwise would have.
That makes advertising measurement fundamentally a question of causality.
Yet many of the industry's most common measurement techniques remain grounded primarily in correlation. They identify patterns associated with sales rather than demonstrating that advertising caused them.
Correlation is often useful. It can improve forecasts, guide optimization, and generate hypotheses. But it cannot distinguish whether advertising created demand or merely found consumers who were already likely to purchase.
That distinction matters. The purpose of advertising is not to predict who is about to buy. It is to persuade people to buy who otherwise would not have. Prediction and persuasion are fundamentally different. Confusing the two can lead marketers to overstate advertising's contribution. Marketing decisions should therefore be based on incremental sales, not coincidental ones.
2. Quasi-experiments are not experiments
Many modern measurement methods attempt to approximate randomized experiments by carefully constructing comparison groups. Matched markets, synthetic controls, Bayesian Structural Time Series (BSTS), propensity score matching, and numerous other techniques all belong to a family of methods known in science as quasi-experiments. The defining characteristic of a quasi-experiment is that the treatment and control groups were not assigned randomly.
Randomization is what makes randomized controlled trials the scientific gold standard. By giving every unit an equal chance of receiving the treatment, it neutralizes both known and unknown sources of bias. Rather than trying to model away differences between test and control groups after the fact, randomization makes those differences equally likely to exist on either side in the first place.
The first rule of quasi-experimental research is to use it when a randomized experiment would be unethical or infeasible. In medicine, it would be unethical to randomly assign people to smoke cigarettes or drink heavily for decades. In advertising, ethical constraints are rarely the issue. Practical constraints sometimes are. National sponsorships, creative already in market, contractual obligations, or channels that cannot be geographically varied may make experimentation difficult or impossible.
But many advertising decisions are amenable to randomized controlled trials, particularly through cluster randomized "geo experiments" that randomize geographic markets rather than individuals. Yet many organizations begin with quasi-experimental methods without seriously considering whether a randomized design is feasible. Familiarity, organizational inertia, perceived operational complexity, or existing investments in modeling tools are understandable reasons to favor quasi-experimental methods. They are not, however, scientific reasons to prefer them over a feasible randomized trial.
When millions of advertising dollars, future revenues, and competitive market share are at stake, the first question should never be, "Which quasi-experimental method should we use?" It should be, "Can we randomize?" Only when the answer is no should quasi-experimental methods become the preferred alternative.
3. Good measurement answers the CFO's question
Not every experiment answers the same question.
Many platform experiments measure how one creative performs against another, or how advertising influences a narrowly defined audience already active on that platform. Those are useful questions.
They are not usually the question the CFO is asking.
The CFO wants to know something much simpler: If I move my next advertising dollar from Channel A to Channel B, which investment will generate more incremental sales?
That requires measuring business outcomes at the level where business decisions are made, not simply measuring behavior within a platform or among a selected audience.
Consider three experiments. Facebook reports a 10% sales lift. TikTok reports a 5% lift. Linear TV reports a 2% lift. At first glance, Facebook appears to be the clear winner.
But those percentages are not directly comparable. Facebook may have deliberately targeted a relatively small audience already exhibiting strong purchase intent, while the TV campaign reached a broad audience with much lower baseline purchase probabilities. A 10% lift among consumers already close to buying is not necessarily more valuable than a 2% lift across a much larger population. Add differences in media costs, and the comparison becomes even more misleading. Each experiment answers the question, "How did this campaign perform within its own context?" None answers the CFO's question: "Which investment generated the greatest incremental return for the business on a comparable basis?"
This is also the question Marketing Mix Models are intended to answer. An MMM estimates the incremental contribution of each marketing channel so budgets can be allocated efficiently across the portfolio. If experiments are used to calibrate or validate an MMM, they should answer that same enterprise-level question. Platform-specific experiments can be excellent tools for optimizing campaigns within a channel, but they are poor calibration data for models designed to compare investments across channels.
The distinction is one of efficiency versus effectiveness. Platform experiments are excellent at improving the efficiency of a channel, helping marketers target the right people, optimize creative, and reduce the cost of acquiring customers within Facebook, TikTok, or another platform. The CFO's problem is different. It is one of effectiveness: deciding which channel deserves the next advertising dollar. Optimizing execution within a channel is not the same as optimizing the allocation of the marketing budget across channels.
The most valuable measurement systems therefore focus on incremental business outcomes at the level where marketing decisions are made, rather than campaign diagnostics at the level where media happens to be delivered.
4. Identity is not necessary for effective measurement
Much of digital advertising is premised on the idea that tracking people is the key to measuring advertising performance.
Often it isn't.
Precision and accuracy are not the same thing. User-level data appears more precise because it records individual impressions, clicks, and conversions. But greater granularity does not necessarily produce more accurate estimates of advertising's incremental effect. In practice, user-level measurement often introduces additional noise through incomplete identity graphs, imperfect match rates, attribution rules, and other assumptions that obscure rather than clarify cause and effect.
The objective is not to reconstruct every consumer's journey. The objective is to determine whether advertising increased sales.
Large-scale geographic experiments can answer that question without identity graphs, clean rooms, household matching, or complex data joins. They also avoid much of the cost, computational overhead, and privacy burden that accompany those technologies. If media can be targeted geographically, and sales can be measured geographically, then advertising effectiveness can often be measured at exactly that same level.
Geo experiments work because they measure outcomes directly rather than attempting to connect millions of individual exposures to millions of individual purchases. The required ingredients are remarkably simple: media that can be geographically targeted, and sales already summarized by postal code, DMA, or another geographic unit. By avoiding the lossy process of matching identities across disparate datasets, geo experiments often produce cleaner estimates with fewer assumptions and less noise.
Sometimes the clearest picture comes from stepping back, not from inspecting every brushstroke.
5. Advertising's sales lift is usually smaller than marketers imagine
One of the most persistent misconceptions in marketing is that successful advertising should produce dramatic increases in sales.
It rarely does.
Across decades of research, advertising has consistently been found to have relatively small sales elasticities. As Donald Lehmann observed in the foreword to Empirical Generalizations About Marketing Impact, a 20% increase in advertising spending typically produces less than a 1% increase in sales
That doesn't mean advertising is ineffective.
A one-percent increase in sales for a large national brand can represent tens or even hundreds of millions of dollars in incremental revenue. Because advertising budgets are usually only a small fraction of sales, even modest sales gains can generate exceptional returns on investment.
The mistake is to confuse sales lift with ROI. A campaign can produce only a one-percent increase in sales and still be enormously profitable.
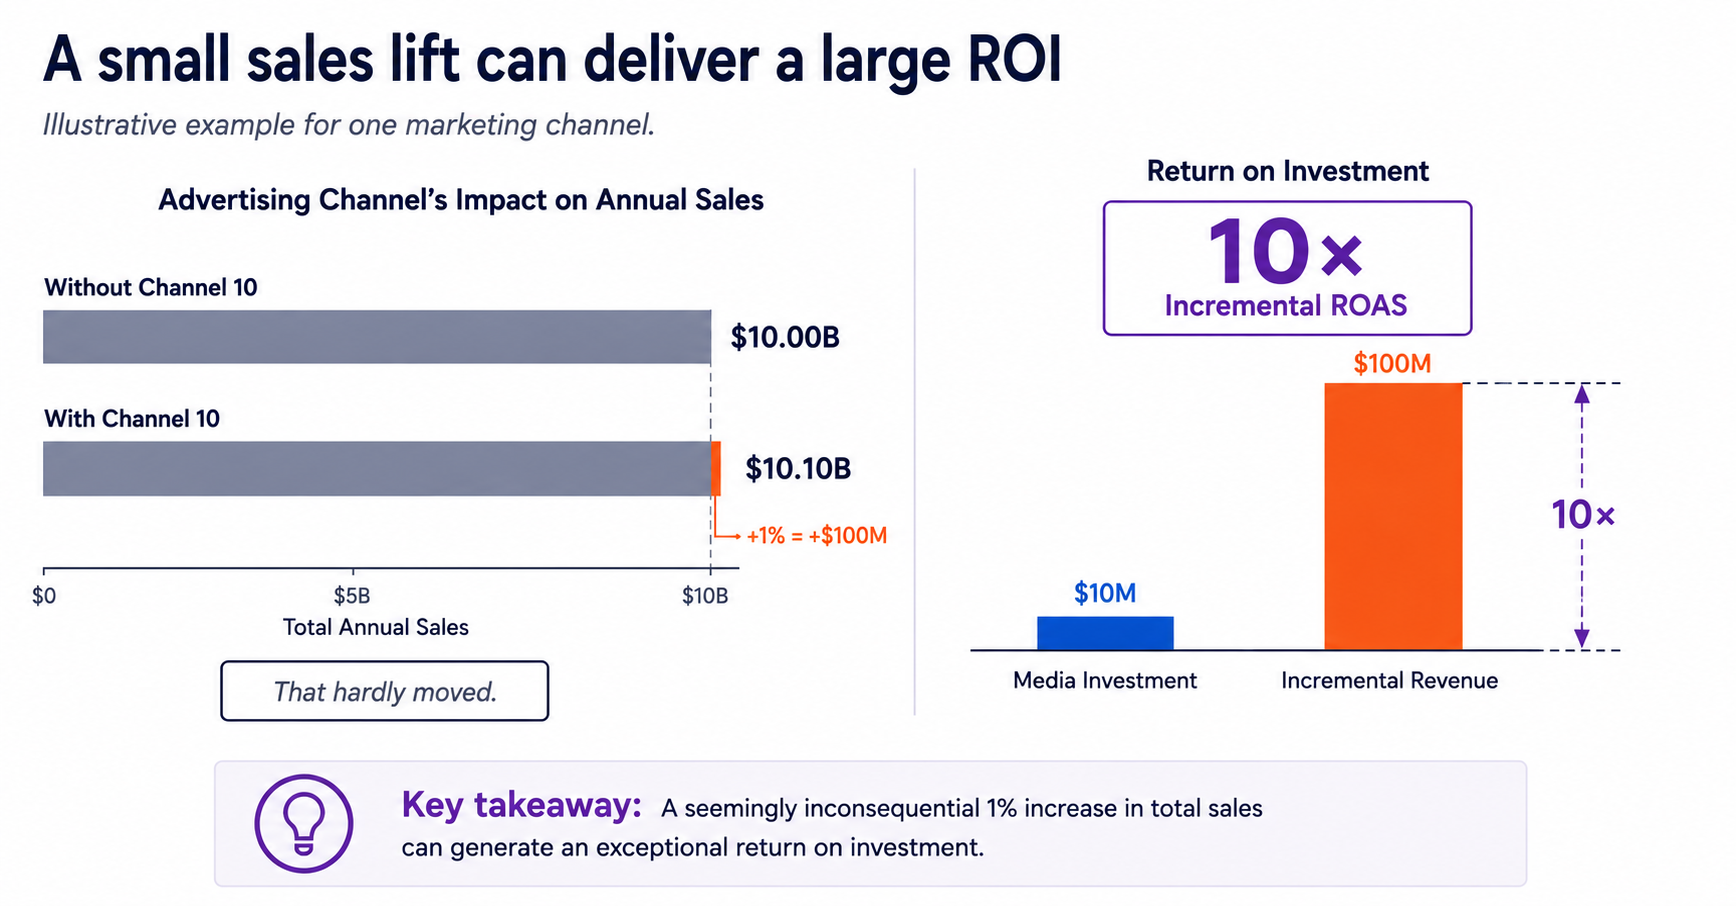
These small effects also have profound implications for measurement. Detecting a one-percent lift requires experiments with sufficient statistical power, careful design, and enough observations to separate genuine signal from ordinary business noise. Methods that rely on noisy observational data, small matched samples, or heavily modeled counterfactuals often lack the sensitivity to measure effects of this magnitude reliably. When the expected lift is only one or two percent, weak measurement methods are more likely to produce unstable estimates than trustworthy answers.
The best experiments are designed from the outset to detect exactly these modest, incremental changes, because those are often where advertising creates its greatest economic value.
Advertising has become extraordinarily sophisticated. Measurement has become even more sophisticated. But the central question has never changed.
Did advertising cause more sales than would otherwise have occurred?
Every methodology should ultimately be judged by how confidently it answers that question.
The better our evidence, the better our decisions.
Timeless Truths About Advertising, Part II
How Ads Influences Consumers
In Part I of this essay series, I argued that many of advertising's most enduring truths are surprisingly simple. Reach generally beats frequency. Broad targeting usually beats narrow targeting. Consistency beats bursts. Those principles describe how advertising behaves. As I noted there, many of those ideas owe a debt to Erwin Ephron's Media Planning, one of the most influential books ever written on the subject.
This installment turns to the consumer. How does advertising actually influence buying behavior? What changes in people's minds, and why does that matter?
Several of the ideas owe a debt to themes developed by Byron Sharp and Jenni Romaniuk in How Brands Grow. Sharp is Professor of Marketing Science and Director of the Ehrenberg-Bass Institute for Marketing Science at the University of Adelaide, Australia, where he and his colleagues have built on the pioneering work of Andrew Ehrenberg to produce one of the most influential bodies of empirical research in modern marketing. The book has generated spirited debate over the years, particularly because it presents many of its conclusions as "laws." I count myself firmly among those who regard it as a seminal work that has profoundly shaped my understanding of how marketing contributes to brand growth.
Together with Media Planning and Darrell Huff's How to Lie with Statistics, How Brands Grow forms the trio of books I have most often recommended to new team members as foundational reading for anyone who wants to understand advertising and marketing measurement.
With that, here are seven more of my timeless truths.
1. Advertising effects decay
Advertising changes behavior, but rarely forever. One of its most important effects is to build what Byron Sharp and Jenni Romaniuk call "mental availability": increasing the likelihood that a brand comes readily to mind in buying situations. That simple idea underlies many of the observations that follow. Advertising builds memory structures and associations that make a brand easier to notice, recognize, and consider when consumers enter the market. But those memory structures gradually fade unless they are reinforced. Marketing mix models capture this by incorporating adstock, a mathematical representation of the way advertising's influence decays over time, recognizing that today's advertisement continues influencing tomorrow's purchases, less so next week, and eventually very little at all.
This is not a weakness of advertising. It explains why advertising works best as a continuous investment rather than a series of isolated campaigns, echoing Erwin Ephron's long-standing argument for continuity that we addressed in Part I. Brand equity is built through repeated reinforcement. When brands stop advertising, they gradually lose mental availability and, eventually, market share as competitors continue reminding consumers they exist. History has shown this repeatedly, particularly when companies slash advertising during economic downturns.
2. More advertising eventually produces less additional impact
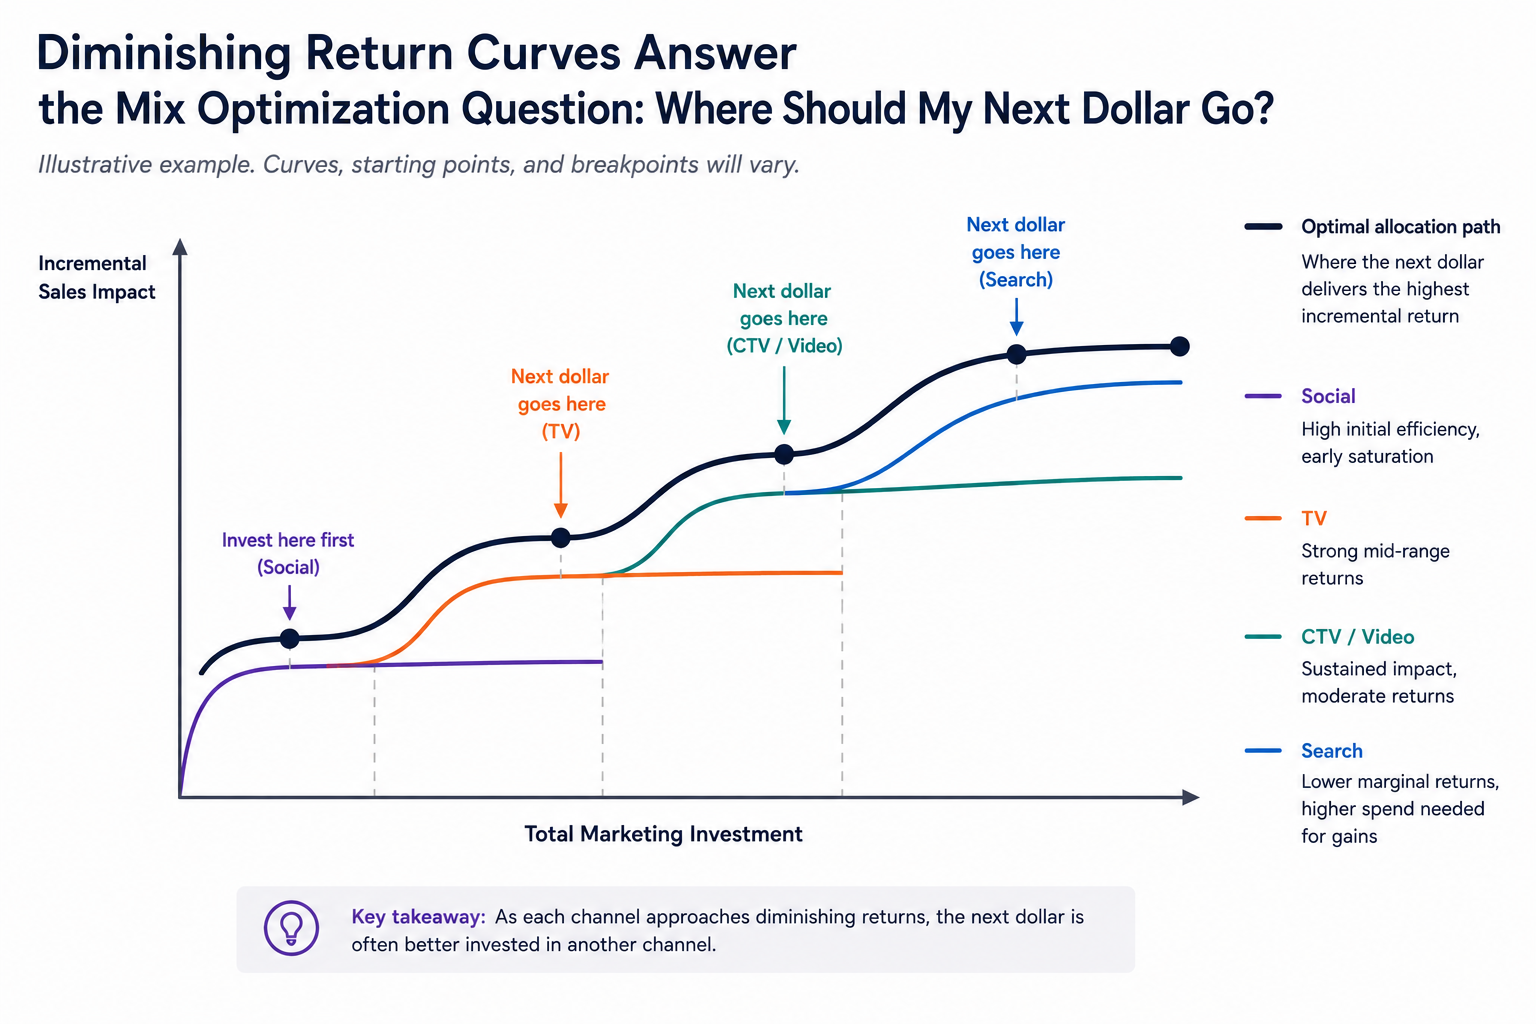
Advertising also exhibits diminishing returns. The first exposure generally contributes more incremental impact than the fifth, and the fifth more than the fiftieth. At some point, additional impressions produce relatively little additional buying behavior. The question is no longer whether more advertising works, but whether the next advertising dollar would work better somewhere else.
This principle appears throughout marketing science: in creative wear-out, frequency-response curves, and the cascading response curves estimated by marketing mix models. It also helps explain why, as discussed in Part I, campaigns often benefit more from expanding reach than accumulating ever-higher frequency among the same consumers. As impressions naturally concentrate among heavy media users, each additional exposure tends to contribute less incremental impact than the one before.
The appropriate lookback window also depends on this relationship. A campaign's impact should be measured long enough to capture delayed response, but not so long that advertising effects have largely dissipated or become entangled with subsequent campaigns. Good measurement identifies where incremental returns begin to flatten, allowing marketers to invest the next advertising dollar where it produces the greatest additional effect.
3. Brand advertising is response advertising
The distinction between brand advertising and performance advertising is often overstated. Both seek exactly the same outcome: influencing future buying behavior. Performance advertising attempts to influence purchases occurring today. Brand advertising attempts to influence purchases occurring weeks, months, or years from now.
Importantly, brand advertising does not wait months before producing any effect. It influences purchases immediately as well, which is precisely why randomized experiments can measure its incremental impact over relatively short periods. A substantial body of evidence, including the work of Les Binet and Peter Field, suggests that the long-term commercial effect of sustained brand advertising often exceeds its short-term effect by a factor of two or more. That long-term effect reflects the cumulative impact of continuous advertising, not the notion that individual advertisements continue increasing in effectiveness with more time after their exposure.
4. Buyer acquisition beats loyalty
Every loyal customer was once a first-time buyer, but advertising's greatest leverage usually lies in creating new buyers rather than persuading existing customers to purchase slightly more often. Decades of empirical evidence, including Andrew Ehrenberg's Double Jeopardy Law, show that brands with larger market shares tend to have both more buyers and slightly higher loyalty. The higher loyalty is largely a consequence of having more buyers in the first place.
This does not mean retention is unimportant. But marketers often overestimate how many customers are truly "lost" to "churn." Most people buy multiple brands within a category and often return after periods of inactivity. The challenge is less about plugging leaks than ensuring more buyers enter the franchise than drift away.
That has important implications for targeting. If you sell dog food, it makes sense to focus your advertising on dog owners rather than the general population. But within that population, the greatest opportunity is usually reaching light buyers and non-buyers of your brand, not simply serving more ads to your existing customers. Occasionally the opportunity is even larger: expanding the category itself by introducing entirely new consumers, as happened during the early years of personal computers and smartphones.
5. Advertising should compete for every buying occasion
No brand owns its customers forever. Consumers are generally more loyal to categories than to individual brands, and every buying occasion presents another opportunity for competitors to gain or lose share. Each trip to the supermarket, streaming subscription renewal, automobile purchase, or restaurant visit is a fresh competitive contest.
The ideas of Ehrenberg-Bass and Erwin Ephron come together here. Ehrenberg and his successors argue that brands grow by reaching broadly across category buyers rather than concentrating on existing customers. Ephron argued that advertising should run continuously because buying occasions occur continuously. Together, they suggest a remarkably simple advertising strategy: reach as many category buyers as practical, and be present whenever they enter the market.
Advertising is therefore less about permanently converting customers than about consistently competing for the next purchase occasion. Yesterday's sale is history. Tomorrow's purchase must be earned again.
6. Advertising influences probabilities, not certainties
Advertising rarely determines exactly what someone will buy. Instead, it changes the probability that a particular brand will be chosen when a buying occasion arises. Millions of tiny probability shifts, accumulated across millions of consumers, become market share.
Modern digital marketing sometimes confuses prediction with persuasion. Algorithms excel at identifying consumers who are already likely to convert. But identifying existing intent is different from creating new demand. The purpose of advertising is not to predict who will buy. Its purpose is to increase the likelihood that more people will choose your brand when they otherwise might not have.
Advertising shapes buying behavior by building mental availability and competing for future purchase occasions. But that raises a vital question: How do we know whether advertising actually worked to drive sales?
That question has occupied marketers for decades, and the answers are often far less straightforward than many vendors would have us believe.
In the next essay in this series, we'll turn to that question. We'll examine more timeless truths about advertising measurement, including why advertising's true sales impact is usually much smaller than marketers imagine, why measuring people is often less important than measuring outcomes, and why the industry's biggest problem isn't fraud, but something far more pervasive.
Next: Part III, How We Know Advertising Worked.
These essays summarize only a fraction of what we cover in Central Control's training workshops. If you're looking to help your team make better advertising and measurement decisions, I'd be glad to discuss a customized workshop for your organization.
Timeless Truths About Advertising, Part I
How Advertising Behaves
After more than two decades working in advertising, I've accumulated a few observations about the enduring patterns that govern the business. Perhaps that's to be expected, particularly since much of my career has focused on measuring advertising's effects. This is the first of a three-part series collecting some of those observations.
Part I examines how advertising behaves: the natural mechanics of media planning, audience reach, frequency, and campaign delivery. Part II turns to how advertising influences consumers, exploring concepts such as recency, adstock, wear-out, brand building, and why advertising changes buying behavior over time. Part III tackles perhaps the most contentious subject of all: how we know whether advertising actually worked. We'll explore incrementality, attribution, targeting, experiments, identity, bots, and why separating cause from coincidence is far more difficult than many marketers assume.
Reasonable people disagree about some of these observations, but they've shaped how I think about advertising and measurement throughout my career. I hope you find them useful.
1. Reach beats frequency
Reach and frequency are advertising's two fundamental currencies. Reach is the number (or percentage) of people exposed to a campaign. Frequency is how often they are exposed. Given a fixed budget, advertisers should generally favor building reach over adding frequency. Brands grow by increasing the number of buyers, not by repeatedly reaching the same buyers. The objective is effective reach, not maximum frequency. Ironically, because of gaps in ad tracking and the fact that frequency tends to accumulate naturally among heavy media users, you're probably buying more frequency than you realize anyway.
2. Frequency is heavily concentrated
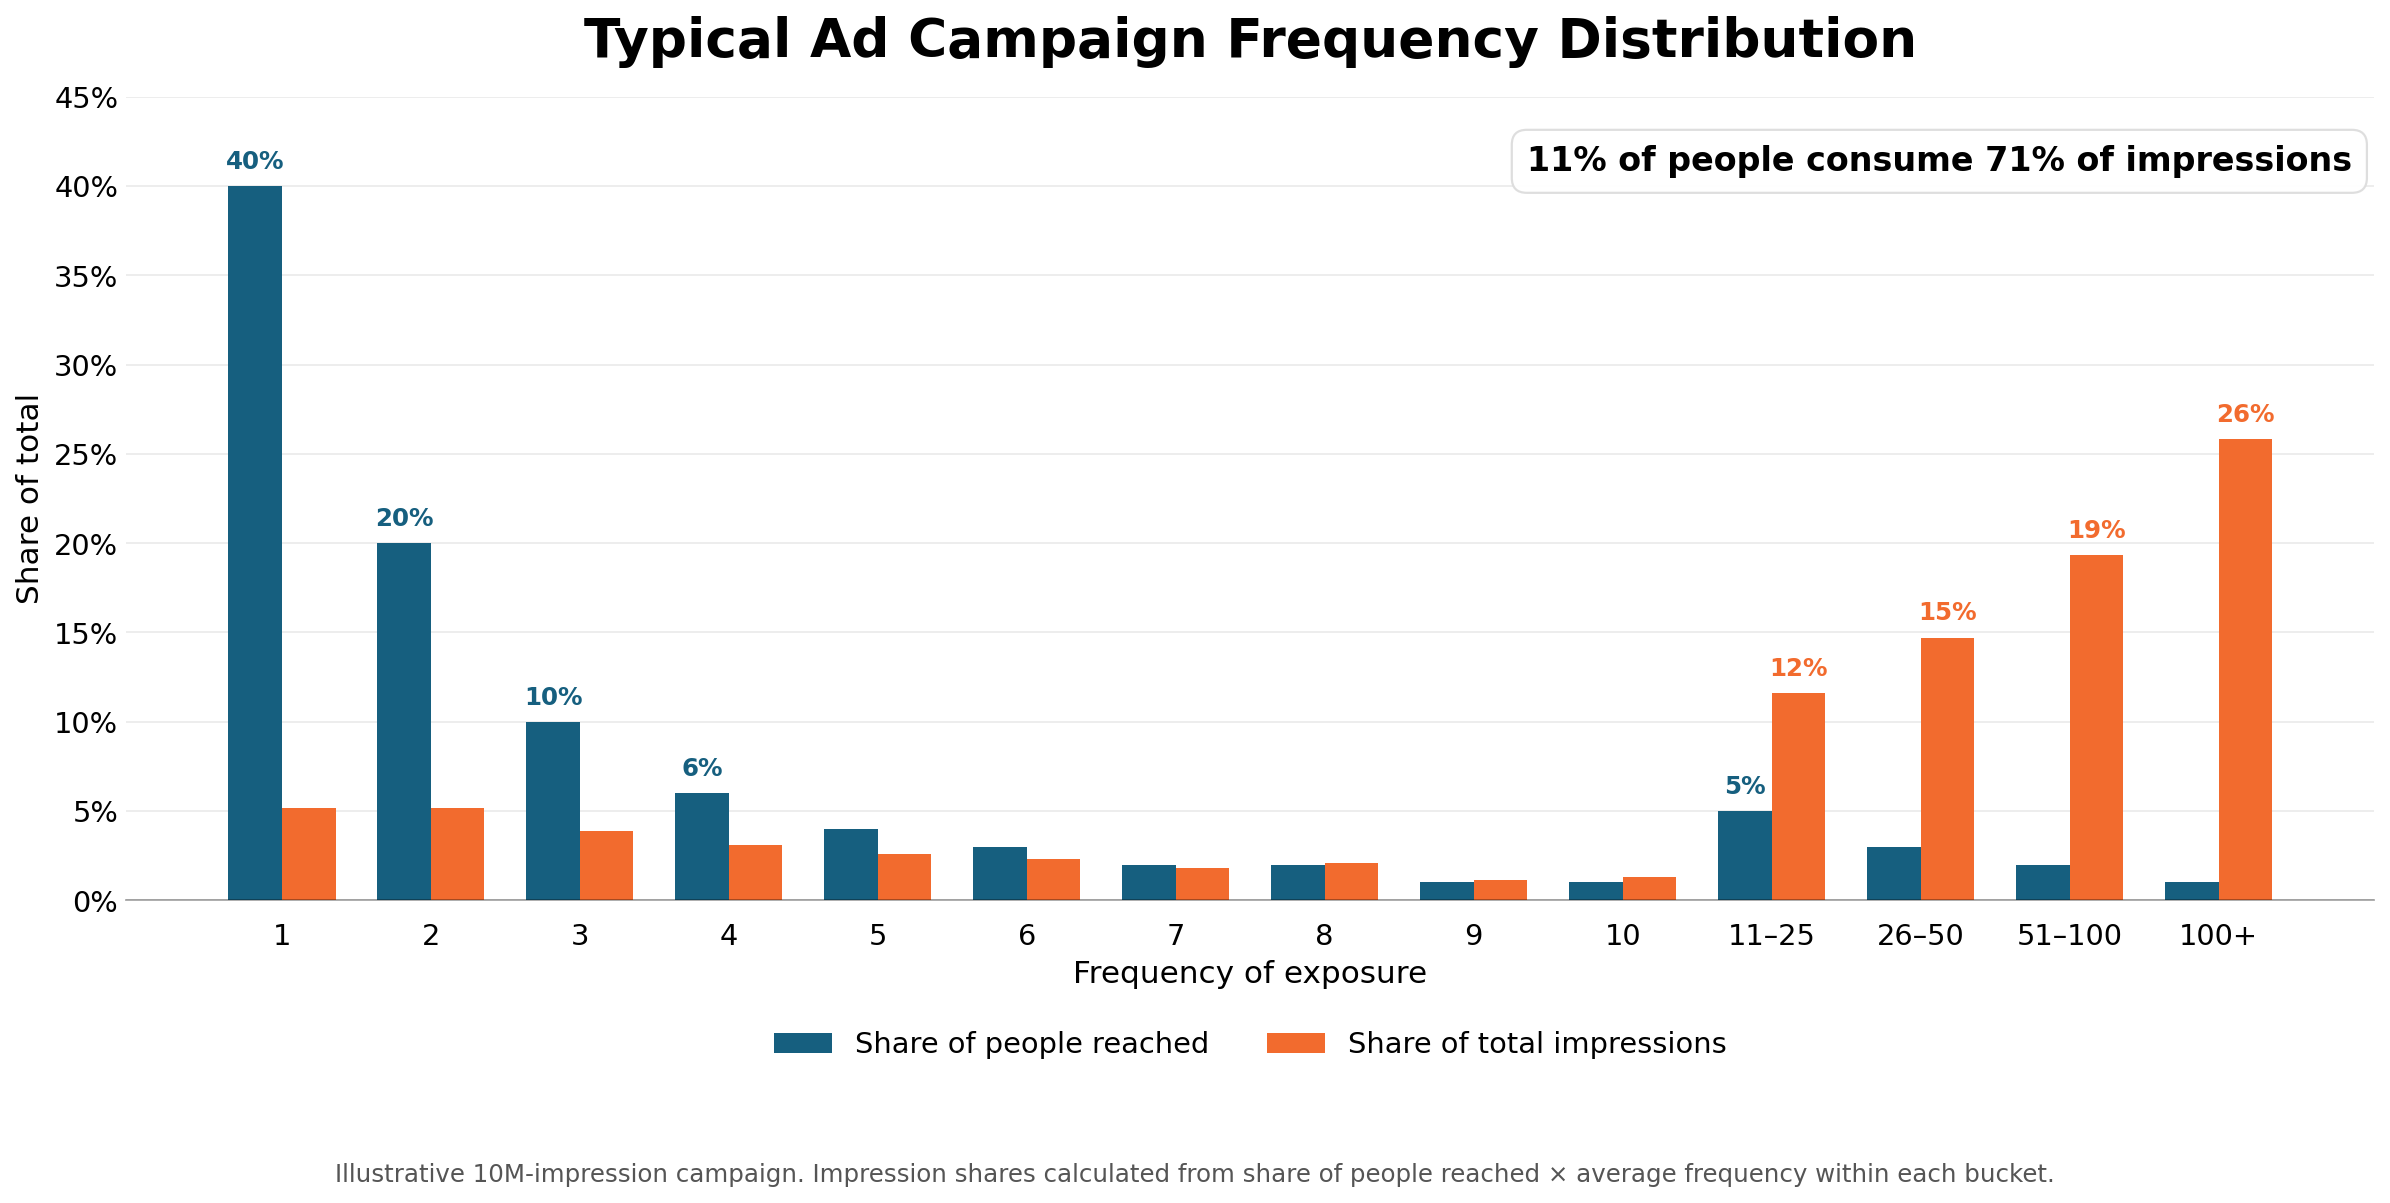
Advertising frequency is not normally distributed. Most people receive only one or two impressions, while a relatively small group accumulates dozens or even hundreds. The result is a heavily right-skewed distribution in which the average frequency can be highly misleading. In the illustrative campaign below, typical of what I've seen studying thousands of campaigns over several years, the mean frequency is 7.7, but the median consumer sees only two ads. Meanwhile, just 11% of the audience consumes 71% of all impressions, a highly inefficient use of ad dollars. Advertisers should examine frequency distributions, not merely averages, and use broader media plans and sensible frequency caps to reduce waste.
3. Broad media plans build more reach
People consume different media. Every additional publisher, platform, or channel reaches some people who weren't reached elsewhere in the media plan. Because audiences overlap only partially, broader media plans usually generate more incremental reach than concentrating impressions in fewer outlets. They also moderate the natural tendency for frequency to accumulate among heavy media users. When the objective is growth, breadth generally outperforms concentration.
4. Most ad metrics are time-bounded
Reach, frequency, click-through rates, conversion rates, sales lift, and virtually every other advertising metric are meaningful only over a specified period of time. A frequency of five means something very different over a day than over a month, just as a 2% conversion rate means something different over a week than over a year. One of the worst reporting habits is to report metrics over the entire life of a campaign. A three-month campaign and a twelve-month campaign are simply not comparable unless their metrics are normalized to a common time period. The same principle applies when comparing against industry benchmarks or historical campaigns. Time is part of the definition of the metric. Ignore it, and meaningful comparisons become impossible.
5. Television is bought in time. Digital is bought in impressions.
The distinction goes to the heart of why television and digital advertising behave differently. This is what's meant by calling television "linear": commercials are inserted into a fixed sequence of programming, and every ad slot exists only once. Like an unsold airline seat or an empty hotel room, if that moment passes unsold, the inventory disappears forever. Digital advertising, by contrast, is bought impression by impression. Every page view, app session, or video stream creates another opportunity to sell an ad, making inventory virtually unlimited. Television inventory is constrained by time; digital inventory is constrained primarily by audience activity. That difference explains why digital delivery naturally concentrates impressions among heavy media users while linear television tends to distribute them more broadly over time.
6. Advertising constancy beats periodic campaigns
The first five observations have been about how advertising is delivered. This one begins to bridge into how advertising influences consumers.
There is a reason the Advertising Research Foundation named its lifetime achievement award after Erwin Ephron. One of the most influential thinkers in the history of media planning, he left behind a body of work that continues to shape the profession decades later. His slim volume, Media Planning, has served as a bible for generations of media planners and researchers. I had the privilege of having lunch with Erwin a few times in the early 2000s. He was as charming and generous as he was influential.
Among Ephron's most enduring contributions was the concept of recency planning, rooted in a substantial body of research showing that advertising has its greatest influence in the few days before a consumer makes a purchase, when they are actively in the market for a category purchase. Because advertisers can't predict when an individual's cereal box will run empty or washing machine will fail, he argued that maintaining a steady advertising presence throughout the year is usually more effective than concentrating budgets into occasional bursts around promotions, holidays, or product launches. For most brands, the same annual budget simply works harder when spread consistently over time than when delivered in intermittent waves.
We'll return to why recency works in Part II, where we'll examine adstock, advertising decay, wear-out, and how advertising changes buying behavior over time.
Next: Part II, How Advertising Influences Consumers.
The W3C Is Making a Critical Mistake About Measuring Advertising Effectiveness
The W3C's proposed Attribution Level 1 standard is intended to provide a privacy-preserving framework for advertising attribution in a post-cookie world. While those goals are worthwhile, the proposal contains a more fundamental problem: it repeatedly treats attribution as a way to measure advertising effectiveness.
Those are not the same thing.
Attribution systems observe advertising exposures and subsequent consumer behavior, then assign credit according to predefined rules or statistical models. They can provide useful operational insights into campaign delivery, such as analysis of reach and frequency and cross-site exposure duplication. But in attaching those dilivered impressions to online conversions they create a persistent illusion of impact analysis. They generally do not estimate the counterfactual: what would have happened if the advertising had never been shown. Without that comparison, attribution cannot reliably measure incremental business impact.
This distinction matters because attribution systems tend to favor channels that harvest existing demand, such as search, retail media, retargeting, and other lower-funnel environments. Meanwhile, channels that create demand, including television, audio, sponsorships, and broader brand advertising, are often systematically undercredited. If these assumptions become embedded in industry standards, they risk influencing media investment for years to come.
At Central Control, we believe advertisers should distinguish between attribution and incrementality. Observational measurement has its place, but causal questions require causal methods. Large-scale randomized controlled trials remain the most reliable way to determine whether advertising actually changed business outcomes.
Read full commentary on AdExchanger: The W3C Is Making a Critical Mistake About Measuring Advertising Effectiveness
Retail Media Networks in Focus: Credibility, Consistency and Incremental Lift
Rick speaking at The Advertising Research Foundation’s Commerce & Shopper Intelligence conference in Chicago, May 12
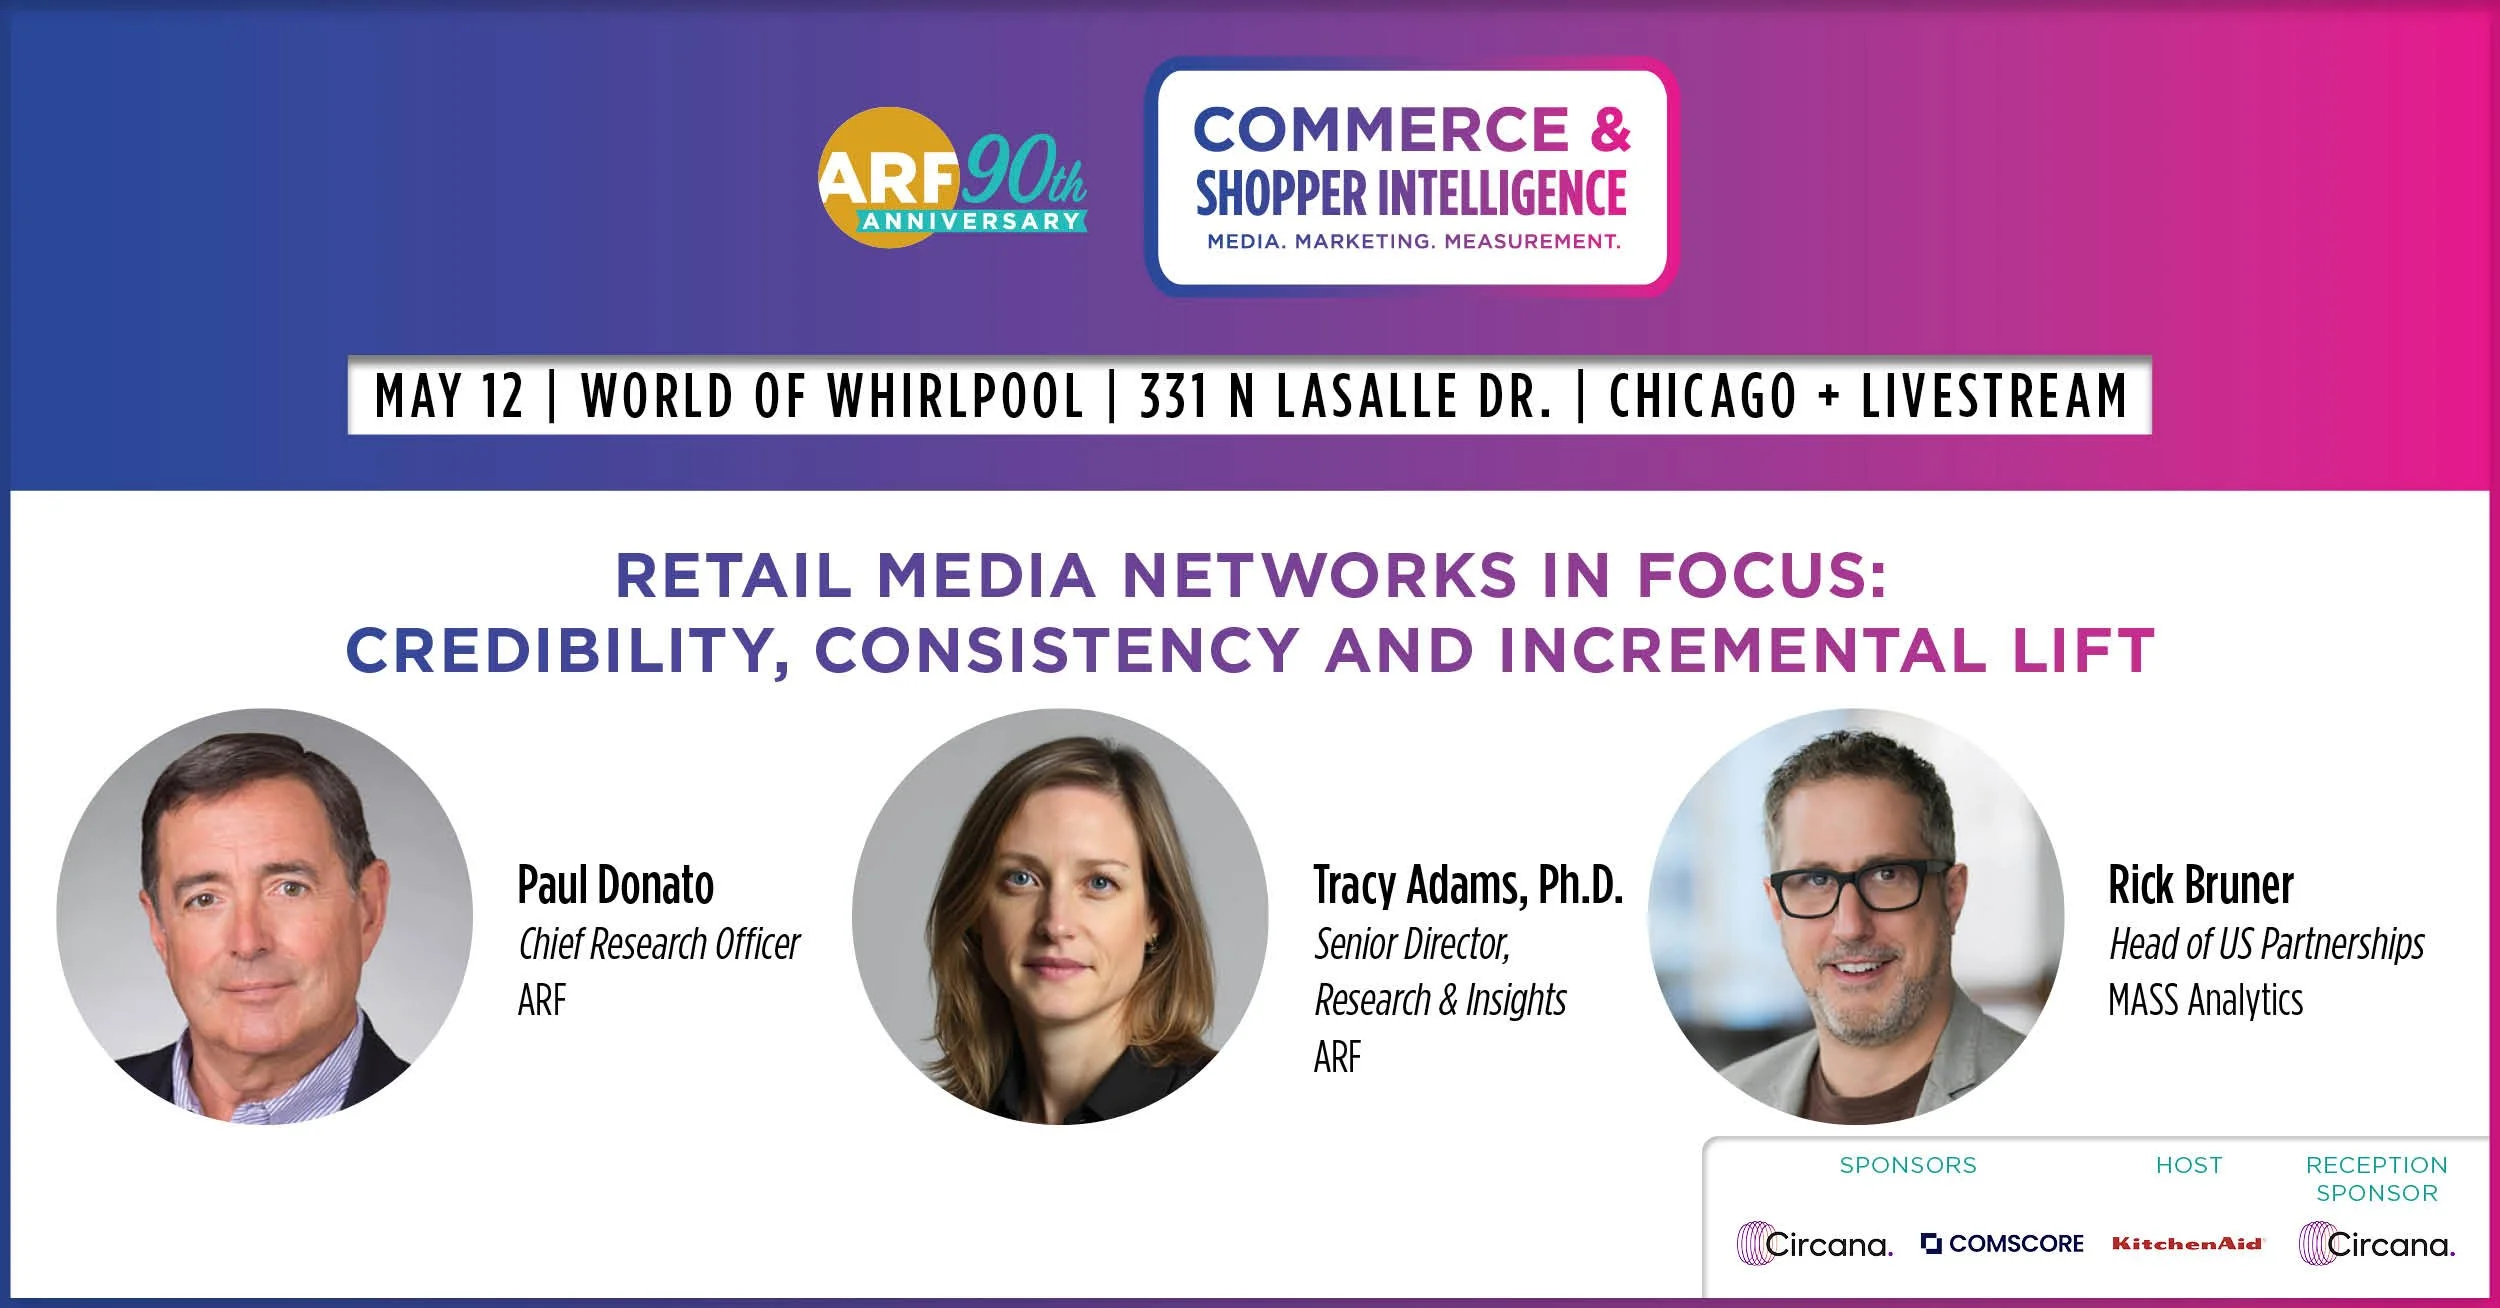
Our CEO, Rick Bruner, will be speaking at the Advertising Research Foundation (ARF)'s Commerce & Shopper Intelligence conference in Chicago next month, May 12.
He’s keeping great company in his session: ARF's Chief Research Officer Paul Donato and its Senior Director of Research and Insights, Tracy Adams, PhD, talking about "Retail Media Networks in Focus: Credibility, Consistency and Incrementality."
Please let us know if you're going to attend or be in town and free for a chat. He'll be rhapsodizing about MMM on behalf our new partnership with MASS Analytics, as well as incrementality experiments, naturally.
Why Geo RCTs Beat User-Level Tests for Ad Sales Measurement

Don’t mistake precision for accuracy
Measuring advertising's true effect on sales is one of the most consequential and contested problems in marketing. Randomized controlled trials (RCTs) are the right tool for it. But not all RCTs are created equal, and the choice of experimental unit, user-level versus geographic regions, has profound implications for what you can actually learn and trust.
The most common objection to geo RCTs is that DMAs are few in number (only 210 in the US) and vary widely in population, wealth, and sales rates. This concern is real but solvable. We address it in detail in our whitepaper How to Design a Geographic Randomized Controlled Trial, but the short answer is that we advocate a multi-armed stepped design we call Rolling Thunder, which naturally improves balance and statistical power. Techniques such as covariate-constrained re-randomization can be layered on for additional assurance.
Let me be clear about what I mean by a geo test. Matched market tests and synthetic control methods are quasi-experiments, not geo RCTs. I advocate full random assignment across all available DMAs, using your own first-party transaction data as the outcome measure. That is a cluster randomized trial (CRT), a methodologically robust type of RCT.
The ITT Advantage
Geo tests are Intent-to-Treat (ITT) experiments on an unfiltered audience. Every person living in a treatment DMA is eligible to be exposed to the advertising (or not, in a suppression test), and you measure what happens to total sales in that geography. That is the question the CFO cares about: how a given channel, vendor, or tactic impacts the bottom line. It is also how market mix modeling wants the data: a clean, national-scope sales lift signal to calibrate media coefficients.
Most user-level tests, by contrast, are Treatment on Treated designs. Ghost ad tests, platform holdouts, PSA-style placebo tests, and clean room lift studies all measure lift among users the platform could identify and target, within the subset whose exposures and outcomes can be observed and matched. That is a fundamentally different question from ITT. It asks: among the in-market users this platform was able to reach, did the ones who saw our ad buy more?
That is a narrower question, on a more selected and already purchase-prone sample. And even when the answer is yes, the incremental effect is confined to the reached audience, which may be a small slice of total sales. Marketing celebrates a statistically significant lift while the finance department scratches its head wondering why they don't see it in the P&L. Geo tests, by measuring total sales across entire geographies, produce a result that maps directly onto the numbers the CFO is already looking at.
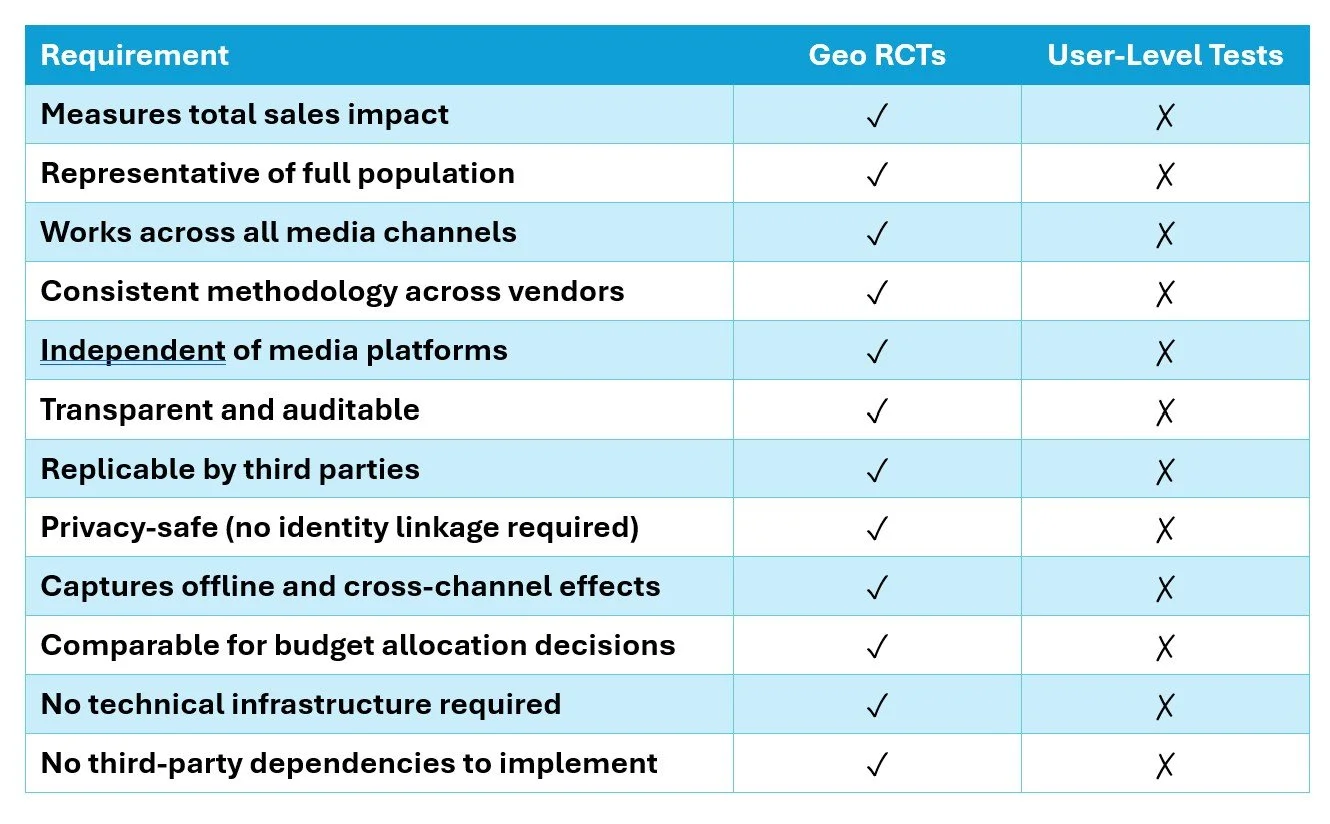
Large-scale geographic randomized experiments check every box of what advertisers want in simple, fair ROI measurement
The Match Rate Problem Is Structural, Not Incidental
Match rates between media-exposed audiences and sales data commonly run 50% or worse (typically between 29% and 63%, says Google). That is not a solvable engineering problem. It is an inherent consequence of how identity works in a privacy-constrained world.
Apple's ATT framework has made large shares of iOS users essentially dark. Users maintain multiple email addresses. Cookie graphs have degraded. Login signals are incomplete outside of walled gardens. The resulting non-matches are not missing at random; they are systematically biased. The unmatched population skews younger, more mobile-first, more privacy-conscious, and more likely to be new-to-category. These are prized customer attributes, precisely the users you most want to understand.
When your lift estimate is based on the matched half of your audience, and that half is systematically different from the unmatched half, you cannot soundly generalize the result to your total population. And since advertising's total lift on sales is typically well under 10%, the noise and bias introduced by a non-random 50% sample can easily overwhelm the signal.
Clean rooms don’t change this. They govern how data is joined and shared, but they don’t increase match rates to anything close to complete coverage, nor do they make the unmatched population representative. The underlying bias remains.
Geo tests sidestep this entirely. Geographic boundaries are stable, well-defined, and match to postal codes already sitting in your transaction data. No joins. No device graphs. No clean rooms. No PII.
Platform-Administered Tests Have a Conflict of Interest
When a media company runs your incrementality test, they control the randomization, the exposure data, and the reporting. It's the classic vendor-grading-its-own-homework problem. This is not an accusation of bad faith. It is a structural problem that no amount of good faith resolves.
As I wrote in The First Principle of Honest Advertising Measurement Is Independence from the Media, sound measurement requires independence in the independent variable. Geo tests give you that. You provide a randomization scheme. You instruct the media company to run in those geographies and not others. You read the outcome from your own transaction data. The media company never touches the outcome measurement.
The Cross-Channel Comparability Problem
User-level test designs are not portable across the media mix. The mechanics depend entirely on the strength of a given platform's user graph, its willingness to support holdouts, and its data-sharing infrastructure. A ghost ad test on search, a clean room lift study on social, and a view-through match on programmatic are three different methodologies measuring three different things in three different conditions. You cannot compare them.
This is compounded by the fact that many of these approaches only observe a subset of outcomes, often limited to digitally trackable conversions, while a meaningful share of sales may occur in other channels (retail, call center, cross-retailer), outside the measurement frame.
Geo tests work the same way for every channel: search, social, retail media, programmatic, linear TV, radio, out of home. The randomization unit (geography), the treatment mechanism (run here, don't run there), and the outcome measurement (your own sales data) are identical across all of them. That is what makes geo tests uniquely suited to the budget allocation question: what is the best use of my next dollar across all channels?
User-level tests, administered by platforms within their own targeting conditions, answer a narrower question: among the users this platform reached in this campaign, did the ad work? Those are not equivalent questions, and conflating them is one of the most expensive measurement mistakes in the industry.
The Targeting Bias Problem
Platforms are expert at harvesting demand. Search and social algorithms identify users already exhibiting signals of purchase intent: behavioral, contextual, lookalike. These users have often already been primed by TV, out-of-home, and other upper-funnel channels. When a platform-run RCT shows that exposed users convert at twice the rate of the control group, it is measuring the incremental value of that final touchpoint on an already-primed, high-intent audience. That is not the same as measuring the channel's contribution to generating demand in the first place.
This is why platform lift studies reliably show impressive numbers that don't survive scrutiny when compared to the accounting P&L or to measurements by geo tests. The lift effect by the platform may be real: within the selected audience, the ad did something. But it overstates the channel's independent contribution to sales and systematically undervalues upper-funnel media that does the priming work but doesn't receive credit in the attribution.
First-Party Seeds Preclude New Customer Measurement
Some advertisers try to regain control by seeding user-level tests with their own first-party customer data. This solves the independence problem but creates a new one: you can't measure new customer acquisition if your randomization universe is your existing customer file. For most brands, new customer acquisition is the primary objective of advertising. A measurement approach that requires you to exclude new customers from the frame is not fit for that purpose.
The Operational Overhead
User-level tests require third-party identity resolution, clean room infrastructure, legal agreements, data transfer protocols, and ongoing engineering maintenance. Each adds cost, latency, and opportunity for error. The clean room ecosystem has matured, but it remains complex, expensive, and dependent on a set of intermediaries who each introduce their own opacity.
Geo tests require none of this. You give your media partners a list of geographies. You read your own sales data. The analysis is transparent, replicable, and auditable by anyone with access to your transaction data and a spreadsheet.
Equal-Sized Test and Control Groups
User-level experiments are often constrained in how they allocate traffic between treatment and control. In practice, control groups are frequently kept small, on the order of 10 to 20 percent, to avoid disrupting campaign delivery. As experimentation expert Ron Kohavi has pointed out, unequal splits can interact with real-world systems in ways that violate assumptions, from caching effects to cookie churn to different convergence rates. A/A tests with unequal allocation often fail for this reason. The result is not just reduced statistical power, but reduced trust in the experiment itself.
Geo designs can avoid this constraint. Multi-armed approaches such as Rolling Thunder can use multiple, equal-sized, randomly assigned arms and can incorporate more than one control group, allowing for balanced allocation and built-in A/A validation. Importantly, this does not require holding out 50 percent of the country. With multiple arms and a stepped design, you can achieve balanced test and control groups while maintaining national coverage, a point I discussed in The Cost of Testing vs. the Cost of Being Wrong.
Geo Tests Are the Simple, Independent Standard Advertisers Have Been Asking For
For years, advertisers have asked for a measurement approach that is simple, transparent, consistent across channels, and independent of the platforms being measured. Something that does not rely on identity resolution, does not require complex infrastructure, and produces results that can be trusted and acted on.
Geo RCTs meet those requirements. User-level tests, in most cases, do not.
User-level tests still have a role. They are useful for creative and audience diagnostics within a platform, and for testing messaging among existing customers. But for the primary question, does this channel drive incremental sales, and how does it compare across the media mix, geo RCTs provide the more reliable answer.
The industry’s obsession with user-level measurement was never really about better science. It was about the internet’s original promise of 1:1 marketing precision, a promise that was always overstated and is now, in a privacy-constrained world, largely undeliverable. Don’t mistake precision for accuracy. Identity is not necessary for accurate measurement.
Cluster randomized trials using geographic units have been the workhorse of causal inference in public health, economics, and policy research for decades. They work because randomization, not identity resolution, is what eliminates confounding. The platforms built identity infrastructure because it served their business models. Advertisers adopted it because it felt rigorous. It isn’t.
Large-scale geo RCTs, reading outcomes from your own transaction data, remain the most reliable method we have for knowing what advertising actually does to sales.
The Cost of Testing vs. the Cost of Being Wrong

Foraging vs. Farming: From careful planting come greater harvests
One of the most common objections to running high quality experiments for measuring advertising's impact on sales is the risk to revenue.
Geo tests, holdouts, and control groups do carry a visible cost. You deliberately withhold media from part of the market. You accept a short-term loss in exposure, and in some cases, revenue.
But that framing misses the real issue. The question is not whether you can afford to test. It is whether you can afford to keep allocating budget without knowing what is actually driving sales.
The visible cost
Testing does have a cost.
A well-designed experiment may temporarily reduce revenue in some portion of the market. For large companies, that can add up to millions of dollars in sales opportunity cost over the duration of the test.
This cost applies mainly to always-on channels such as search, social, retail media, and TV. Holding out these ads feels like stepping away from demand, even though several of these are also lower-funnel channels most prone to over-crediting conversions. For channels that are used periodically or at low levels of spend, testing typically carries little downside and may reveal incremental upside that current measurement fails to capture.
Even so, the cost is real. It is also bounded and temporary. More importantly, it is visible.
The invisible cost
What is less visible is the cost of getting the allocation wrong.
Most measurement systems that advertisers depend on today, whether last-click attribution, platform-reported lift, matched market tests, or synthetic control methods, are not direct measures of causality. They are approximations, each with their own sources of bias.
Last-click and platform reporting tend to favor bottom-of-the-funnel channels that harvest demand. Matched market and synthetic control approaches are quasi-experimental. They rely on constructing a counterfactual that is never directly observed, and the degree of error is unknowable. That makes them risky foundations for multi-million dollar decisions, especially when measuring lift sizes typical in advertising, which are often just a few percentage points.
Marketing mix models are powerful, but they depend on variation in the data, and that variation is often limited by the very budgets they are trying to evaluate. As Leslie Wood, a recipient of the ARF Erwin Ephron Demystification Award, once said to me, “People talk about Bayesian priors in their models. What they mean is last year’s budget.”
None of these methods are useless. But none are neutral.
Small biases in measurement lead to small biases in perceived performance. When those biases are applied to large budgets, the consequences are not small.
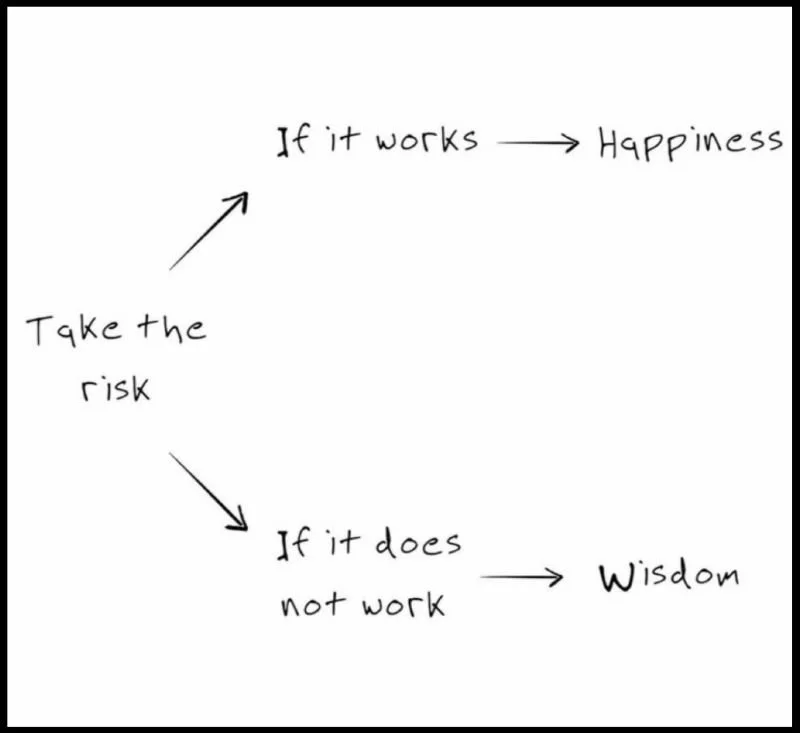
Hat tip to Avinash Kaushik
A simple example
Consider a hypothetical company with $4 billion in annual revenue and a $400 million marketing budget.
It spends $60 million on television and believes TV contributes 2 percent of sales, implying an ROI of about 1.3.
Now run a properly designed geo experiment.
As described in our whitepaper, How To Design A Geographic Randomized Controlled Trial, we advocate a design that uses all U.S. DMAs, randomized into multiple test groups that are staggered over time, a design we call Rolling Thunder. This approach provides strong statistical power and balance while limiting how much media is disrupted at any point.
More than half of geographies are included in the test, but because the groups are staggered, only a fraction of total media delivery is affected at once. In a typical setup, about 36 percent of total media exposure is impacted during the test window.
If the true effect of TV is 3 percent of sales, then only 3 percent of that 36 percent is at risk during the experiment. Spread over a seven week period, or about 13 percent of the year, the total impact is roughly 0.14 percent of annual sales.
For a $4 billion company, that is about $6 million.
That is the cost of the experiment.
Now compare that to the learning.
If the company believed TV drove 2 percent of sales but the experiment shows it is actually 3 percent, that is a $40 million difference in annual incremental revenue and an ROAS of 2.0. That upside repeats every year.
More importantly, with a better understanding of TV’s true impact, the company can reallocate more budget into television, increasing total incremental revenue further.
This example simplifies reality. It ignores diminishing returns and reach constraints. But the direction is clear. The fear of short-term loss obscures a much larger opportunity.
What experiments actually do
Experiments introduce deliberate variation.
Instead of waiting for the budget to move, they move it on purpose. Instead of inferring causality from historical patterns, they create conditions where causality can be observed directly.
This is not a replacement for modeling. It is a complement to it.
Experiments provide the signal. Models help interpret and generalize it. Without that signal, models are limited to what they have already seen.
The asymmetry
The economics are straightforward.
The cost of testing is temporary. The effect of misallocation is ongoing.
An experiment may expose millions of dollars in short-term revenue risk. But if it leads to even a modest improvement in allocation, the benefit repeats every time the budget is deployed.
Over a year, or several years, the math is not close.
The cost of testing is bounded. The cost of being wrong is not.
The real decision
Marketers often think the risk in their budgets comes from waste, or from the cost of testing.
The real risk is failing to recognize where the upside is. It is continuing to allocate based on incomplete information. And, most critically, it is being forced to cut budgets under pressure without knowing what is actually driving results.
That is how companies end up cutting the channels that are doing the most work.
No one is deciding whether to spend money on testing in isolation. They are deciding how to deploy hundreds of millions of dollars in media.
The cost of testing is easy to see. It shows up immediately in the markets you hold back.
The cost of being wrong is harder to see. It shows up quietly, in how budgets are allocated, year after year.
But it is often far larger.
You can cap the cost of an experiment. You cannot cap the cost of a bad allocation.
MASS Analytics and Central Control Announce Global Partnership

Models Plus Experiments, a better standard for measuring ROAS
Bringing models and experiments together
MASS Analytics and Central Control have partnered to combine always-on marketing mix modeling (MMM) with large-scale, privacy-safe incrementality testing.
The goal is straightforward: connect continuous, system-wide measurement with direct causal validation, so advertisers can make better decisions with greater confidence.
Built on a modern data foundation
MASS Analytics’ Always-ON Analytics platform (MassTer PACE) is available on the Snowflake Marketplace, providing a cloud-native environment for continuous model refresh and analysis.
Running MMM directly on modern data infrastructure reduces latency, improves data reliability, and allows models to update as new data arrives, rather than on a fixed reporting cycle. This is most effective when models update continuously and experiments are used to validate and recalibrate them in-market.
What each side brings
MASS Analytics provides its Always-ON Analytics platform, a cloud-native MMM system designed for continuous refresh on modern data infrastructure.
Central Control provides experimental design and execution, including geo-based randomized controlled trials that measure incremental sales impact directly from first-party transaction data.
A combined measurement approach
Models Plus Experiments (MPE) sits at the top of the hierarchy of advertising evidence, combining the coverage of models with the causal clarity of experiments.
Models and experiments serve different purposes.
Models provide coverage, continuity, and a system-wide view of performance across channels.
Experiments provide causal evidence, isolating the incremental effect of advertising on real business outcomes.
Used together, they reinforce each other. Experimental results calibrate and validate model outputs. Models help identify where testing will be most informative and cost-effective.
Why this matters now
Measurement has become more complex and less reliable.
Identity-based approaches are increasingly constrained. Platform-reported metrics are not comparable across channels. Many methods rely on assumptions that are difficult to validate.
At the same time, marketing decisions still require clear answers: what is driving sales, and where should the next dollar go?
This partnership is built to address that gap with a practical, transparent approach grounded in experimentation and supported by modeling.
U.S. partnership and role
As part of the partnership, Central Control will serve as MASS Analytics’ U.S. partner for commercial and client-facing work.
Rick Bruner will take on the role of Head of U.S. Partnerships at MASS Analytics.
What comes next
The firms will work together on client engagements, joint measurement frameworks, and published guidance on integrating MMM and experimentation.
The focus is on making this combined approach operational: faster to deploy, easier to interpret, and aligned to real decision cycles.
Internet Media Turns A Third of a Century Old. 2026 Promises More of the Same: Upheaval

One of the first ad banners in history, AT&T's prophetic "You Will" campaign, from HotWired (of Wired magazine) and other sites, 1994.
2026 marks 33 years since Marc Andreesen invented the web browser, 32 since AT&T’s prophetic “Have you ever clicked your mouse right HERE?” ad banner, and 30 years since DoubleClick pioneered ad-tech, Rex Briggs invented brand lift surveys, and Procter & Gamble, Yahoo and GoTo conjured the scourge of cost-per-click ad pricing.
Like all of us at that time in our lives, “new media” finds itself pondering weighty questions of adulthood like, “What the hell am I doing with my life?” “Why do I keep repeating these same terrible patterns?” and “Would my parents even be proud of me?”
The industry that promised 1-to-1 targeting still thrives on click farms, vaunted accountability really means impenetrable statistical hokum, and all-knowing automation remains directed by gut instincts.
Yet 2026 feels like another of the rare hinge years, akin to the shift to programmatic a decade ago, when the foundational architecture of digital media changes, not just its surface tactics.
It’s worth remembering the trail of industries and companies already reshaped or erased in these waves. Once mighty print media is now the realm of bowtie-wearing nostalgists. The era of the Big Three (martinis and broadcasters) now sits in a nursing home with its mad men protagonists. Portals like Yahoo and AOL, once the center of the web, are brand ghosts. Agencies like Modem Media, Organic, Tribal DDB, and iTraffic defined early digital but no longer exist. Even the engines of the first ad-tech boom—Overture, 24/7 Media, DoubleClick, ValueClick, BlueKai, AppNexus—have been absorbed, dismantled, or forgotten.
And yet the next transformation is already underway. Below are the key advertising trends that will define 2026 and the decade to come, with AI omniscience, identity collapse, supply-chain contraction, and shifting media economics combining to reset the rules once again.
1. Barbell Market of Ad Tech and Publishing
The middle of the market continues to erode. Mid-tier DSPs and SSPs without proprietary data or differentiated supply are losing relevance, as are mid-sized publishers reliant on open-programmatic revenue. Identity decay, shrinking margins, supply-path optimization, and tighter control of demand all push the ecosystem toward a barbell structure. Large platforms and specialized niche providers can survive; the middle struggles to maintain durable economics. The open programmatic ecosystem is contracting, not expanding.
2. Retail Media 2.0 and the New Walled Gardens
Retail media networks have expanded far beyond on-site search placements into full-stack platforms with closed-loop attribution, proprietary identity graphs, and integrations into CTV, DOOH, and off-site display. Their advantage is transaction-level truth, which no other channel can match. As identity degrades elsewhere, RMNs become central sources of targeting, measurement, and audience extension. They will continue to draw budget from open-web display, brand advertising, and promotional programs across the retail ecosystem.
3. Ads as Code: The API-ification of Ad Serving
Ad serving is shifting from a monolithic platform into a modular execution layer controlled through code, as Brian O’Kelley has observed. Creative logic, pacing rules, bidding models, and optimization frameworks are increasingly set via APIs rather than UI controls. Programmatic becomes infrastructure rather than marketplace. This enables federated auctions, server-side decisioning, and bespoke bidding logic outside legacy DSP structures. Intelligence moves from the exchange to the advertiser’s own model.
4. Reinforcement Learning Replaces Rules-Based Optimization
Buying logic is shifting from rules-based bidding to adaptive models that optimize for incrementality, profit, and lifetime value. As user-level signals weaken, platforms must learn from incomplete feedback, turning audience expansion, pacing, and creative selection into reinforcement-learning problems. Products like Performance Max, Advantage+, and Amazon’s automated formats reflect this shift, even as their underlying models remain opaque. Meta aims for fully automated advertising by 2026, with others close behind. Advertisers set objectives and let the systems take over, often with more faith in platform alignment than careful evaluation. The need for independent effectiveness testing grows as automation expands.
5. Identity’s Dirty Secret: Clean Rooms, Dirty Data
Identity is fragmenting faster than the industry can patch it. Clean rooms proliferate but they often match limited, noisy data to similarly incomplete datasets. Deterministic identifiers are scarce, probabilistic signals are inconsistent, and interoperability remains elusive. The tools improve while the underlying inputs degrade. The industry continues to discuss precision while working with persistent imperfection.
6. MFA 2.0: Junk Thrives in a Machine-Buying Marketplace
Made-for-Advertising sites are not a moral failing; they reflect the incentives of the marketplace. They are likely to gain prominence in 2026, not recede. As automated bidding relies on broad, surface-level signals, MFA becomes more attractive to the algorithms buying most open-web media. Cheap, predictable traffic keeps these systems stable while legitimate mid-tier publishers contract. The industry’s talk about transparency and quality remains largely aspirational, and many buyers still default to set-it-and-forget-it approaches. In an automated marketplace, Goodhart’s Law applies: if a metric can be gamed, it will be. MFA prospers because it aligns with how the system rewards performance today.
7. CTV and Retail Media Succeed Because They Are Closer to the Money
CTV’s growth is driven less by shifting consumer behavior than by structural efficiency. It has fewer intermediaries, higher working-media ratios, and a cleaner identity framework than open-web display. Retail media succeeds for an even simpler reason: retailers own the point of sale and the data that governs it. In both cases the advertiser moves into channels where spend is more directly tied to commercial outcomes and less dissipated through opaque supply chains. Budget follows efficiency, control, and proximity to the transaction.
8. Unified Measurement Platforms
Multitouch attribution has waned with the loss of user-level signal, but most marketers are not adopting true randomized experiments at scale. Instead, a new class of measurement platforms has emerged, combining quasi-experimental methods, synthetic controls, incrementality modeling, attribution logic, and modern MMM into cohesive systems. Some operate through always-on pipelines, others in cycles, but all aim to reconcile modeled and experimentally informed outputs into unified reporting. Companies such as Mass Analytics, Arima, Measured, Haus and LiftLab are defining this transition.
9. Cross-Media R/F Measurement and the Aquila Ambition
Aquila, the ANA’s latest effort to unify reach and frequency across linear TV, CTV, YouTube, social, and digital, addresses a real need in a fragmented landscape. But it is attempting to solve a problem of near quantum-level complexity. The industry has long prioritized counting impressions because that is what advertisers buy, while investing considerably less energy in the easier and more meaningful question of causal impact. R/F remains a how-long-is-a-piece-of-string problem, and Aquila inherits the same structural constraints that limited earlier attempts. It reflects a genuine appetite for independent measurement, but its progress depends on cooperation from platforms that benefit from opacity.
10. Bots Advertising to Bots
AI search is becoming a no-click environment, with AI Engine Optimization already displacing SEO in many categories. Consumer decision-making is shifting to AI shopping agents that evaluate products and transact on behalf of users. On the advertiser side, automated bidding systems increasingly manage spend without human involvement. As both sides of the marketplace automate, the early outlines of machine-to-machine advertising emerge. Media-buying bots will negotiate with consumer shopping bots, and more commerce will occur without human intermediaries or the psychological levers that once defined advertising’s role.
Three decades in, digital advertising continues to prove one constant: the ground keeps shifting. But 2026 feels less like another incremental turn and more like a structural reset, one that rewrites the economics, rewires the infrastructure, and moves much of the decision-making from people to systems.
The only thing AI can't do in advertising is measure true ROI

“You’re going the wrong way, dammit!” (The Poseidon Adventure, 1972)
AI is the future advertisers deserve.
Someone recently asked for my take on the WSJ opinion piece AI Is About to Empty Madison Avenue, whether I thought it was overhype or not. In short, no, I don’t think it’s hype.
Industry watcher Don Marti observed in a recent piece that advertisers could defend themselves from losing the advertising game to Big Tech. (They could do it for themselves by using higher-quality measurement techniques. Better yet, the IAB, ANA and other bodies could refer to the blueprint for fixing the whole ROI mess, which Marti cited, that I wrote in AdExchanger more than a year ago.) But in a piece he wrote a couple of weeks earlier, he makes a more convincing argument that they probably won’t, because they’re sleepwalking into oblivion.
I think the AI hype is real. The saying goes that we regularly overestimate the impact of new technologies in the short term and underestimate their impact in the long term. But in this case, the future is already here. AI is moving at the pace of a runaway train.
Not all profound technical advances fundamentally alter professions. Photography, for example. While film manufacturers and processors were rocked, and camera makers lost significant market share to high-quality cell phone cameras, photographers themselves have remained strongly employed. It’s a case of Woody Allen’s Law: 80 percent of success is showing up. Someone still needs to attend the wedding, the bird-watching expedition, the celebrity outing to hold the camera and click.
But that’s not so much the case with most advertising jobs. There’s nothing particularly physical to do. AI is already showing up with the skills needed to do most of the jobs in advertising: understanding the brief, planning the media, developing the creative, executing the buy, delivering and counting the impressions. That whole value chain sits squarely in AI’s sweet spot. And it can crank it all out in minutes, take endless feedback, and make revisions with the most insidious can-do attitude imaginable, without so much as an eye roll.
Tilly Norwood, Sora 2, Advertising Context Protocol: the writing is scribbling on the wall so fast you’d think AI was writing it itself.
This Ad Age story about Butler/Till claiming to have executed the “first” fully AI ad campaign, soup to nuts, is likely to read like a quaint footnote in a year’s time. Talk about a dubious claim to fame. More like an epitaph.
Google, Meta, and Amazon already command the lion’s share of ad spending, and they’re highly automated and increasingly AI-driven. Zuck has said he envisions cutting out all the middlemen and automating all components of the ad stack between the brief and the conversion, which sounded boastful a few months ago but now seems blindingly obvious.
I had an aha moment a couple of weeks ago while attending a Sports Media summit hosted by Operative. Carter Satterfield, a Google Cloud sales executive, shared this story. He’s a big sports lover, spending hours each week coaching his son’s hockey team. On the train ride to the conference, he paused his scrolling to watch a video ad featuring a father and son bonding over the kid’s hockey team. When the kid scores a goal at the end of the ad, Carter realizes he’s wearing the same jersey number Carter himself wore all through high school.
“I can’t be sure it was an AI-generated ad, but it certainly could have been — all of the details are there in my social feed to put it together,” he said. “I don’t normally cry on Amtrak. But I did this morning.”
When’s the last time you could even remember an internet ad you’ve seen? And here was one that brought a seasoned ad professional to tears. It felt like a real tipping point. I’ve contended for years that one-to-one marketing was the biggest fallacy of digital advertising, since the ads weren’t really designed for or targeted to one person. But now, they literally can be.
None of this is to say the future of advertising is going to be better than it was. Or more effective. I’m old enough to know how to spell “bologna” because my baloney has a first name. Advertising impact used to endure for a lifetime.
All that said, there is one thing AI cannot do accurately — the most important thing: measure ROI accurately. But perversely, advertisers just don’t seem to care.
ROI for most advertisers is falling in inverse proportion to Big Tech valuations going up. Advertisers are steadily paying more for less ROI, and Google, Meta, and Amazon are laughing all the way to the blockchain.
If there is one thing marketers have even heard about causation — which, of course, is the ultimate point of advertising, causing consumers to buy your product who wouldn’t have otherwise — it is that correlation is not causation. But AI, you see, is nothing but correlation. Very fast and very sophisticated statistical inference. The fact remains that to truly know what is having an effect, you need to conduct a randomized experiment: subjects assigned at random to a test or control group, presented with an intervention where they are either treated or not with the stimulus of interest (the ad), and measured against the outcome of interest (incremental sales).
A click isn’t that. Attribution modeling isn’t that. Synthetic controls, matched-market tests, double-debiased machine learning, stratified propensity score modeling, and all manner of other “baffle them with bullshit” mechanisms of statistical inference are not that. Those are all forms of correlation. True experiments — randomized controlled trials — are really the only way to know, really know, what kind of effect a marketing strategy is having.
But we don’t need AI to tell us that most marketers will settle for lesser evidence. Self-reporting AI “optimization” engines with Newspeak names like Performance Max and Advantage Plus gobble up ever larger shares of ad spend, while marketers watch their cost-per-acquisition rise.
I used to think about this stuff and feel like Reverend Scott, Gene Hackman’s character in The Poseidon Adventure, screaming at the people convinced they needed to go to the ship’s bow, now underwater, to get out instead of following him to the engine room, now above water, because the ship was upside down.
How does it even make basic business sense that the seller would devise systems that optimize the deal to the buyer’s best interest, not the seller’s own?
“You’re going the wrong way, dammit!”
But over the years, I heard from enough people to realize that whether the advertising works isn’t really the priority in the advertising business. Even though, of course, it should be. What they mean is that it isn’t their priority, in their job function, or in their self-interest. Their priority, and that of their colleagues across the advertiser, the media company, the agency, the whole stack, is simple: spend the money. Spend it as fast as you can, lest, God forbid, there’s budget left over and you get less next time. Whether it really works or not isn’t their concern, so long as they have a nice chart to show their boss afterward. Test and learn be damned.
Shoot first and ask questions later. Kill ’em all, let God sort ’em out.
All I can do is preach. Most people probably think I’m just an old man shouting at clouds. But here and there someone hears me who recognizes the truth in what I’m saying, and I can help a few souls at a time, like Reverend Scott.
What do I think AI portends for advertising? Mothers, don’t let your babies grow up to be cowboys. Or, as Frank Zappa put it: don’t you know you could make more money as a butcher?
Foundational Models for MMM: Interesting, but Built on a Stable Base?

Amazon Ads recently published an intriguing whitepaper proposing a “foundational model” approach to Marketing Mix Modeling (MMM), analogous to how large language models like GPT learn generalizable patterns across many data sources.
It’s an appealing idea: a shared, privacy-safe model that learns from many brands, reducing noise and cost while improving consistency. But I can’t help wondering whether this foundation may rest on shifting ground.
MMMs are, by nature, models. They depend heavily on the assumptions, priors, and data chosen by their modelers. A “foundational” MMM trained on hundreds of brand-level models risks compounding those assumptions rather than correcting them. And when synthetic data enters the mix, the system depends further on abstractions. (See our recent blog post on the risk of AI designing ad optimization on non-experimental assumptions of causality.)
It brings to mind Nassim Taleb's cautions about systems built on interconnected dependencies createing fragility, e.g., financial models leading up to the 2008 mortgage crisis. When many players adopt the same flawed premise, the system becomes brittle.
Aside from one passing reference, what's missing from the whitepaper is a discussion of validation through high-quality experiments. Randomized controlled trials (RCTs) remain the best evidence for causal advertising impact. In the hierarchy of evidence, only meta-analyses of many RCTs ranks higher. The industry should focus on building toward benchmarks of incrementality RCTs to calibrate and test any MMM foundation, preventing models from recursively learning from other models.
And it’s worth remembering who is proposing this. Amazon is now in the MMM business, joining Google’s Meridian and Meta’s Robyn. As I argued in The First Principle of Honest Advertising Measurement Is Independence from the Media, credible measurement depends on independence. It’s hard not to be cautious when the companies selling most of the media are also building the tools to “prove” its ROI.
Foundational MMMs could be a leap forward, but only if their footing is grounded in experiments, not self-reference. Don't build sand castles on the beach at low tide.
(Join the discussion of this essay on LinkedIn.)
The First Principle of Honest Advertising Measurement Is Independence from the Media

When you buy a house, you rely on the surveyor and the structural engineer—people who don’t work for the seller. When you pick a restaurant, you trust the health inspector’s “A” in the window, not the chef’s Yelp review. When you invest, you care that the books have been vetted by an independent auditor. Yet in advertising, marketers routinely let the seller grade its own reporting.
That contradiction should make any serious business leader pause. The single most important principle of credible measurement—independence—is still the rare exception in marketing.
The missing audit culture
Across mature professions, independence is non-negotiable. ISO/IEC 17025 requires that testing laboratories “be impartial and be structured and managed so as to safeguard impartiality,” ensuring protection from undue influence or conflicts of interest. The U.S. GAO’s Yellow Book demands that auditors be organizationally independent from those they audit. Clinical trials rely on independent data-monitoring committees to stop studies if conflicts distort findings (ISO; GAO; ICH Guidelines).
The logic is the same everywhere: no matter how advanced the math, if the measurer benefits from a positive result, the credibility is shot. Advertising somehow missed that memo.
A cultural blind spot
Many advertisers genuinely want to measure impact better, but legacy incentives often get in the way. Marketing departments are rewarded for deploying budget efficiently, not for proving whether that budget truly drove incremental sales. It’s understandable, but it creates a blind spot.
Meanwhile, there’s no shortage of metrics: reach, impressions, viewability, clicks, attention, engagement. Each enjoyed its moment in the sun, but none answers the CFO’s central question: How many sales happened that wouldn’t have happened without the marketing spend?
Too often, advertisers accept ROI reports produced by the same entities selling them media or managing their buys. Agencies and platforms rarely hide their preference for internally run “studies” that tend to deliver friendly numbers. Vendors openly admit (over drinks with other vendors) that clients rarely prize accuracy in reporting results. One senior product head at a major agency told me, “Why would we want third-party randomized controlled trials? That only introduces risk for us.” A top consulting firm, hired by a major digital platform, confided that they use that platform’s internal synthetic-control mechanism “because the results are regularly favorable for them.”
Like drunks using lamp-posts: for support rather than illumination, What independence protects
Independence is not a nicety; it’s the foundation of credible causal inference. It protects against three forms of bias:
In design. When the party that profits from the outcome designs the test, parameters conveniently align with its interests.
In analysis. Data processing, covariate selection, and modeling choices can subtly tilt results. Independence enforces transparency.
In interpretation. Even an honest analyst may face pressure to present “directionally positive” findings. Structural separation shields objectivity.
In statistical terms, independence reduces systematic error, the enemy of validity. In business terms, it’s an insurance policy against self-deception.
Other fields learned this long ago
Financial markets insist on auditor independence because self-auditing destroyed companies from Enron to Wirecard. Laboratories maintain impartiality accreditation (ISO 17025) because test results affect safety and trade. Clinical researchers separate trial oversight from sponsors to protect patients and truth. Forensic labs maintain chain-of-custody independence to keep prosecutors from tainting evidence (ISO; GAO; ICH; National Academies Press).
Advertising commands billions in corporate capital every year. Why should its measurement standards be lower than food safety or bridge engineering? Granted, no one dies when campaigns underperform, but companies live and die by market share, a zero-sum game where those who measure best have a valuable edge.
A few bright spots
There are encouraging examples, such as Netflix, eBay, and Indeed, which have built experimentation cultures rooted in transparency and rigorous testing. They prove that independence and scientific discipline aren’t academic ideals, they’re competitive advantages.
More advertisers are beginning to follow suit. For those genuinely striving to optimize media spend, demanding verifiable incremental impact isn’t risky, it’s liberating. It clarifies what truly works and earns credibility across the business.
What independence doesn’t mean
It doesn’t mean outsourcing everything to a third-party vendor. Advertisers themselves are independent from the sellers and can build capability in-house. The key is structural separation: the people whose performance depends on campaign success shouldn’t be the same people validating its impact. The CFO’s team doesn’t audit its own books; marketing shouldn’t either.
Yes, I run a company that performs independent experiments for advertisers. I have skin in the game. But the principle stands regardless of who executes the measurement: someone must own the truth, and it cannot be the party selling, or even the one buying, the ads.
A better path forward
This industry doesn’t lack intelligence or ambition. It lacks a measurement culture grounded in independence and evidence. Marketers deserve clarity about what’s truly driving growth. Vendors that can prove genuine incrementality should welcome that scrutiny; everyone else will raise their game or fade away.
If marketers spent half as much energy insisting on credible causal measurement as they do chasing vanity metrics, the entire ecosystem would benefit. Media sellers would compete on actual performance, not on weaponized opacity. Agencies would be valued for insight, not self-preservation. CFOs would trust marketing again.
The principle that scales
Independence isn’t optional. It’s the first condition of truth. Many disciplines that measure cause and effect learned this long ago. Advertising is simply overdue to catch up.
If you’re still taking the media company’s ROI slide deck at face value, well, I do live in Brooklyn. Maybe you'd be interested a nice shiny bridge?
The Compounding Power of Long-Term Advertising: A Review of the Evidence

A question came up on the Research Wonks list about the impact of advertising short-term vs. long-term. (If you don't know the Wonks, sign up at ResearchWonks.com: forum of ~1500 media researchers.)
I googled then AI-ed. Below are some influential works on the subject. ChatGPT summarizes the consensus thusly:
Long-term impact is typically 2–5× the short-term effect. This ratio appears consistently across academic (Hanssens, Mela), industry (Sequent Partners, Gain Theory), and practitioner (Binet & Field) research.
Short-term metrics underestimate ROI. Campaigns optimized for near-term sales often misallocate budgets away from high-ROI brand building.
Different mechanisms drive each timescale: short-term activation (rational persuasion, promotions) vs. long-term brand effects (emotional memory, reduced price sensitivity, loyalty).
Sustained investment compounds results. Continuing advertising reinforces brand memory and repeat purchasing; stopping spend causes rapid decay.
Media and creativity matter. Broad-reach, emotional campaigns (especially on TV and high-quality digital) generate stronger long-term multipliers.
Best practice: balance roughly 60% brand / 40% activation spending and evaluate outcomes over multi-year horizons to capture the full economic impact.
Evaluating Long-Term Effects of Advertising, Sequent Partners, 2014
Short- and Long-term Effects of Online Advertising: Differences between New and Existing Customers, Breuer et al., 2012
What Is Known About the Long-Term Impact of Advertising, Hanssens, 2011
The Long-Term Impact of Promotion and Advertising on Consumer Brand Choice, Mela et al., 1997
The Long and the Short of It, Binet et al.,
Focusing on the Long-term: It’s Good for Users and Business, Hohnhold, 2015
Five key results from our long-term impact of media investment study, Chappell, Gain Theory
Giving Marketing the Credit it Deserves, Rubinson, TransUnion, MMA
The Hierarchy of Advertising Evidence
In medicine and other sciences, the “Hierarchy of Evidence” ranks research methods by the strength of their causal claims, with meta-analyses of randomized controlled trials at the top and anecdotal opinion at the bottom. Advertising faces the same challenge: separating true incrementality from correlation. This hierarchy adapts that framework to advertising, showing how experimental methods — ideally randomized controlled trials (RCTs) — provide the most credible evidence of causal impact. Quasi-experimental and observational approaches, such as marketing mix models, synthetic controls, or attribution, remain widely practiced and valuable, especially when experiments are impractical (e.g., in small national markets or for channels like in-store promotions). Still, because these approaches lack randomization, they depend on modeling choices and statistical assumptions that are harder to verify, and thus they are subject to bias, overfitting and provide less certain evidence of causal impact than experiments.
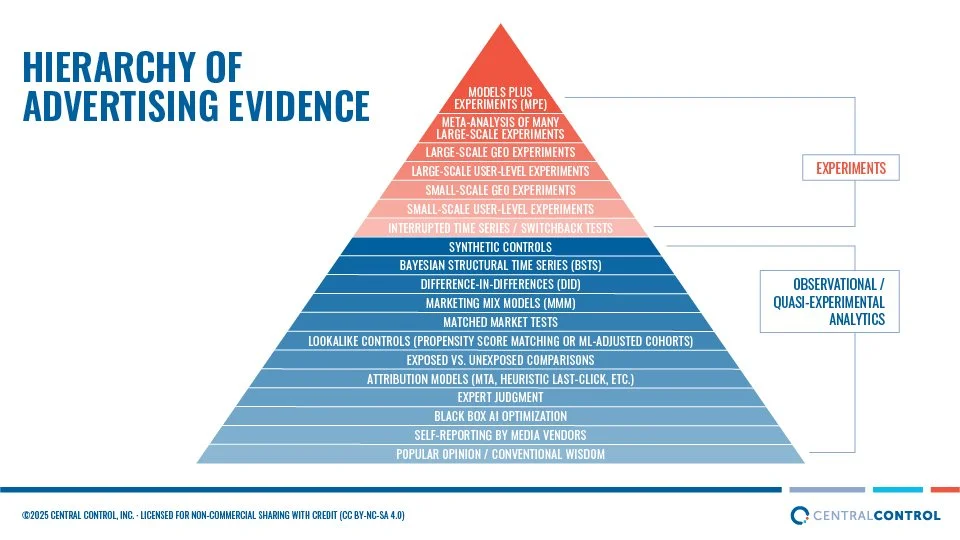
Experiments
Models Plus Experiments (MPE) – Most rigorous framework: routinely validating MMM (or other models) with RCTs; combines scale of models with causal credibility of experiments.
Meta-Analysis of Many Large-Scale Experiments – Aggregating results across multiple RCTs; strongest external validity.
Large-Scale Geo Experiments (Cluster RCTs) – Random assignment of all geo regions within a country (e.g., DMAs); a consistent, robust, and scalable framework applicable across virtually all media channels.
Large-Scale User-Level Experiments – Randomizing millions of IDs; high internal validity but limited by cross-device fragmentation and low match rates, noisy for measuring small ad lifts.
Small-Scale Geo Experiments – Still randomized but less power, higher risk of idiosyncratic bias from a few markets.
Small-Scale User-Level Experiments – Feasible but often underpowered; generalizability limited.
Interrupted Time Series / Switchback Tests – Turning campaigns on/off repeatedly; can work if treatment effect is immediate and reversible, but vulnerable to temporal confounds.
Observational / Quasi-Experimental Analytics
Synthetic Controls – Weighted combination of control units to construct a “synthetic twin”; can provide credible counterfactuals but sensitive to donor pool and overfitting. (E.g., Meta's GeoLift R package.)
Bayesian Structural Time Series (BSTS) – Flexible probabilistic framework for counterfactual forecasting with covariates, trend, and seasonality; powerful but dependent on priors and specification choices. (E.g., Google's CausalImpact R package.)
Difference-in-Differences (DiD) – Compares changes in treated vs. untreated groups over time; intuitive and widely used but hinges on the parallel trends assumption.
Marketing Mix Models (MMM) – Longstanding regression framework using aggregate longitudinal data to estimate channel contributions; offers a holistic view of the mix but causal claims depend on assumptions unless validated by experiments.
Matched Market Tests – Selects untreated markets that resemble treated ones; easy to explain but prone to hidden bias.
Lookalike Controls (Propensity Score Matching or Machine Learning–adjusted cohorts) – Construct control groups matched on demographics, purchase history, or other observables; widely used in research panel-based lift tests but subject to hidden bias from unmeasured factors.
Exposed vs. Unexposed Comparisons – Naïve lift tests comparing those who saw ads to those who didn’t; easy to run but confounded by targeting bias.
Attribution Models (MTA, heuristic last-click, etc.) – Useful for exploring customer journeys, but correlation-based and not causal evidence.
Expert Judgment – Can inform hypotheses or priors, but not empirical evidence.
Black Box AI Optimization – Proprietary “incrementality” claims without transparency; credibility requires experimental validation.
Self-Reporting by Media Vendors – Metrics reported by the seller; rife with bias and not reliable for causal claims.
Popular Opinion / Conventional Wisdom – Lowest rung; anecdotal, not evidence.
How to interpret results from a randomized controlled experiment correctly
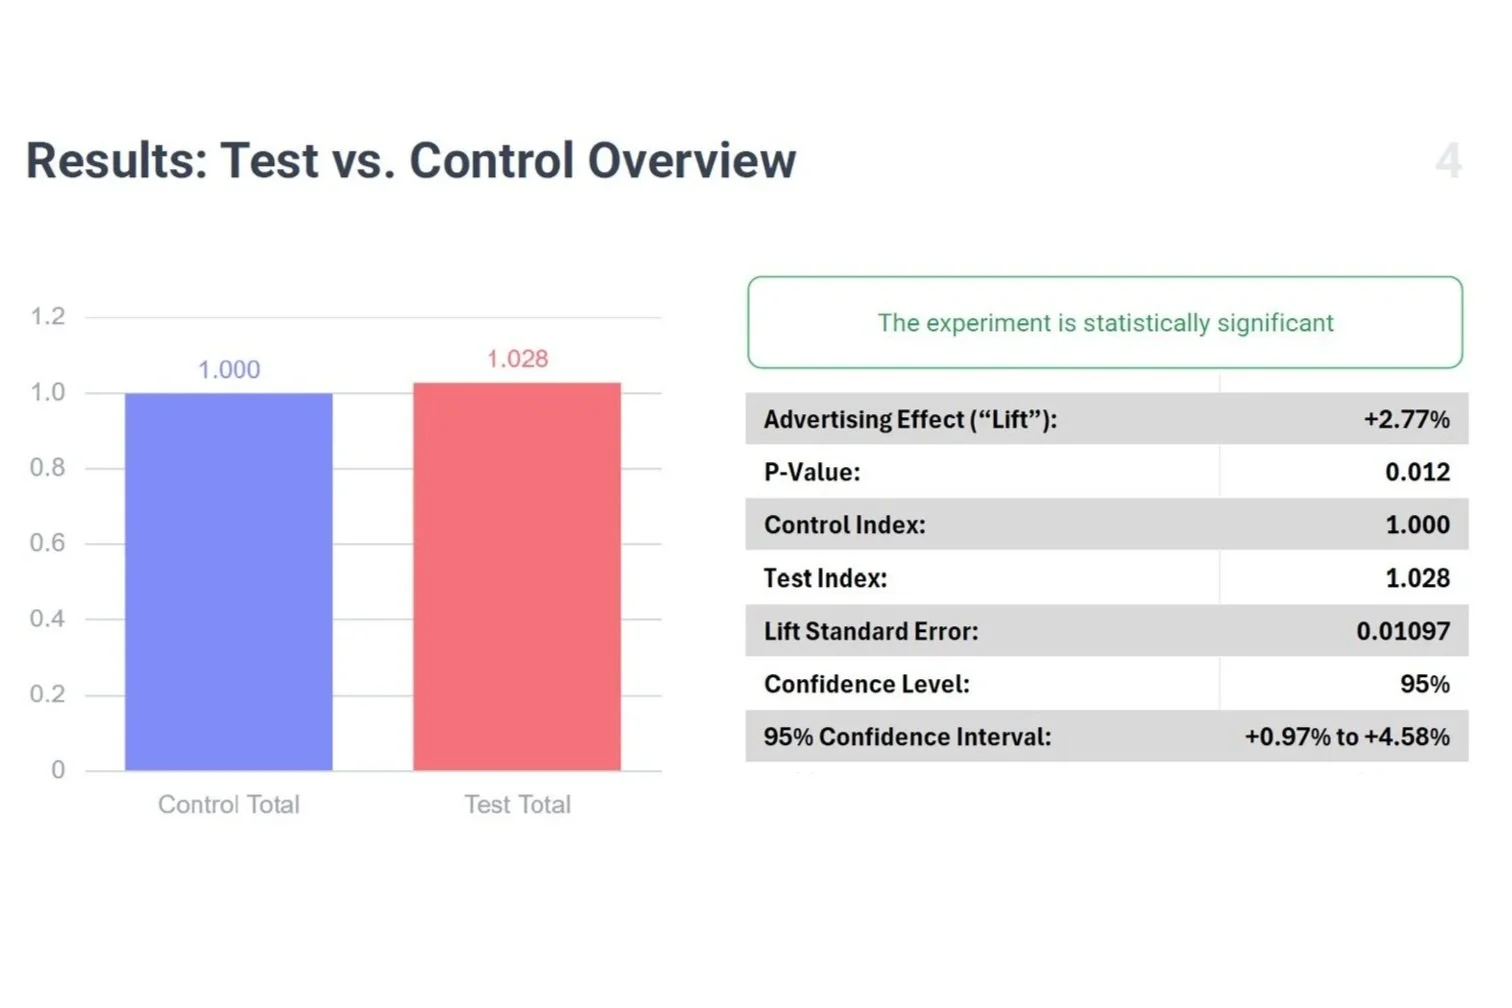
Screenshot of reporting from Central Control’s platform Experiment Designer
In the Research Wonks forum (recommended for all marketing analysts: visit researchwonks.com for details), I was asked my opinion on a thread titled "Does stat testing encourage the wrong decisions?" The heart of the question was how to interpret tests that aren't deemed quite "statistically significant," yet the profit value of the product is very high and purchase rates are very low (e.g., boats, solar panels, home owner's insurance).
Here is a modified version of my response, which is really a bit of an explainer on experimentation statistics themselves. As I noted in an earlier post in the forum, all of this pertains to well-constructed randomized controlled trials (RCT). If your definition of a test is relying on synthetic controls, matched markets or other quasi experimental methods, I'm much more skeptical of the results overall. More on that below.
Marketers often fixate on the 95% confidence level as the determinant of whether a test was “valuable” or not, when that's only one component of what makes an experiment result meaningful. It’s also often misunderstood.
Confidence level (CL) measures the likelihood that a result is a false positive — a Type I error. It’s not really saying “there was almost certainly a positive lift.” It’s saying that if you ran the test under the same conditions an infinite number of times, about 5% of the time you’d see a lift when in fact there wasn’t one. In other words, a false positive (Type I error).
The p-value of the test has an inverse relationship to the CL: a p-value under 0.05 indicates significance at the 95% CL.
It goes without saying that this foundation of statistics clearly describes an impossibility: the threshold of infinity notwithstanding, in advertising, test conditions are always unique, where each is a one-time snapshot of a combination of the creative, offer, audience, media, point in time, etc. But statistics is theoretical stuff. In a class on regression I once took, the professor described the concept of a “parent population,” being the theoretical infinite number of samples you could draw under the model, and the “daughter population,” which is the single sample you actually observed. The p-value, and most other statistical metrics, refer back to the likelihood that your daughter population correctly represents the “true” (theoretical) population.
Power describes the likelihood that your test will detect a positive result if one really exists. The common convention in experiment design is 80% power, which can feel low, since it’s answering the critical question: “Will I actually detect a lift if it’s there?” For experiments supporting high-stakes decisions, you might power for 90%. Unfortunately, power isn’t something you get as a marker in the results (like the p-value); it’s a design property, determined up front by inputs including sample size and the effect size you care about.
The maddening part is: with 80% power, if you fail to reject the null (i.e., no significant lift detected), there’s still a 1 in 5 chance that a true lift of the size you powered for was actually present, but your test missed it due to random chance, such as an unlucky draw of randomly assigned experiment units, ill-winds blowing from the south, etc. This is a Type II error, a false negative.
Which leads to three other important topics: confidence intervals, Bayesian thinking, and the value of an accumulated body of evidence.
Confidence intervals (CIs) are often neglected in superficial reporting of test results, but they’re crucial for interpretation. A CI shows the plausible range of effect sizes given your data, which bears on the original question in the Wonks forum: how to interpret significance in the case of high-value, low incidence transactions.
Ideally, results should look like: “Estimated lift = 5%, p = 0.04, 95% CI = +0.2% to +9.8%.” The p-value tells us the result just clears the 95% confidence level (so the false-positive risk is controlled at 5%). The CI tells us the range is fairly wide: the true lift could be as small as +0.2% or as large as +9.8%. So, even with a test that is "significant" at a 95% CL, the actual sales impact could vary widely, which is key for ROI. The measured effect size is really just a point estimate.
The formula is: CI = Estimate ± (Zα/2 × SE)
If you're using a 90% (or 80%) confidence level, and the lift is deemed positive but the p-value is > 0.05, then the 95% CI will straddle zero — meaning the data are consistent with no effect, a small positive effect, or even a negative effect. That’s why 95% CL is a useful rule of thumb, as a p-value of less than 0.05 assures the whole range of the CI will be greater than zero.
Beware the temptation to run one-tailed tests in ad experiments, where the presumption is the effect could only be positive. Ads can backfire. Think of the X10 camera from years ago — pioneer of the notorious pop-under ad format — that so annoyed people it arguably created negative lift. That logic also shows up in uplift modeling, where one audience segment is “sleeping dogs,” whose purchase likelihood can be harmed by advertising.
Bayesian analysis offers a more flexible interpretation than the rigid frequentist thresholds. Most MMM models today are Bayesian. In that mindset, even a p-value of 0.15 can be treated as evidence pointing toward a positive lift — not definitive, but suggestive, and potentially worth acting on depending on priors and expected ROI.
Finally, I always stress that the greatest confidence comes not from any one test but from a body of evidence built through repeated RCTs. In the hierarchy of evidence, the only thing stronger than a single well-run RCT is a meta-analysis of many of them. The closer you get to that “infinity of tests,” the more solid your knowledge becomes. Big advertisers, agencies, MMM shops, and publishers who accumulate 10s, then 100s, then 1000s of RCTs build a serious moat in their understanding of what really works across ad formats, CTAs, publishers, channels, product categories, and so on.
Of course, as I said at the top of this essay, all of these statistics are on shaky ground if your “testing” relies on synthetic controls, matched markets, propensity scores, machine learning, or other forms of quasi-experiments. Quasi-experiments can be useful if true RCTs are infeasible (rare in advertising) and/or if the expected effect size is very large. But if you’re chasing a 1-10% effect with a quasi-experiment, I wouldn’t bet the farm.
I wrote recently on LinkedIn that with enterprise AI systems poised to take over media planning, there’s a real danger those systems will train on quasi-experimental results — which pervade ROI measurement in advertising — and institutionalize bad learnings, creating a huge “knowledge debt” that will take years to unwind. Garbage in, garbage out.
Recommended further reading on the subject:
Close Enough? A Large-Scale Exploration of Non-Experimental Approaches to Advertising Measurement (Gordon et al., 2022)
Predictive Incrementality by Experimentation (PIE) for Ad Measurement (Gordon et al., 2023)
Enterprise AI is coming, and it's about to learn all the wrong lessons about marketing effectiveness (my essay)
How to Design a Geographic Randomized Controlled Trial (a detailed, 50+ page whitepaper by Central Control, a big hit with experimentation experts)
NEW WHITEPAPER: How to Design a Geographic Randomized Controlled Trial

Download the whitepaper here (no registration required).
After years of advocating for better advertising measurement, I'm excited to share a comprehensive guide that doesn't just explain WHY geographic RCTs are superior for measuring true incremental ROI, it shows exactly HOW to implement them.
This 50+ page whitepaper includes:Step-by-step design frameworks for "Rolling Thunder" and other experiment designs
Detailed Python code examples for randomization, analysis, and power calculations
Statistical methodologies that deliver unbiased, transparent, replicable results
Implementation checklists to ensure experimental integrity
Real-world case studies demonstrating the approach in action
For too long, marketers have relied on observational and quasi-experimental methods like matched market tests, synthetic controls, and attribution models, which tend to systematically overstate performance. As I've written previously, these approaches might be "customer pleasing," but they're leading to billions in misallocated ad spend.
The truth is that geographic RCTs aren't comparatively difficult or expensive to implement, they're just unfamiliar to many practitioners. This guide demystifies the process and provides everything you need to start measuring true incremental impact.
Download the whitepaper here (no registration required).
If you're responsible for major advertising investments and want to know what's really working, this is your roadmap to better measurement and better results. For questions, training or support implementing these techniques, please reach out. I'm always happy to discuss how this methodology can transform your measurement approach and marketing effectiveness.
#MarketingMeasurement #Incrementality #ExperimentalDesign #AdvertisingEffectiveness #DataScience #iROAS
Enterprise AI is coming, and it's about to learn all the wrong lessons about marketing effectiveness
🚨 TL;DR: Most advertisers will train AI systems on flawed campaign measurement data, risking a generation of misinformed media planning.

By Rick Bruner, CEO, Central Control
Last week's I-COM Global summit was, once again, a highlight of the year for me. While its setting is always spectacular (Menorca was no exception) and the fine food and wine certainly helped, what truly distinguishes I-COM is the quality of the discussions, thanks to the seniority and expertise of attendees from across the ad ecosystem.
The dominant theme this year: large organizations preparing for enterprise-scale AI. We heard from brands including ASR Nederland, AXA, Bolt, BRF, Coca-Cola, Diageo, Dun & Bradstreet, Haleon, IKEA, Jaguar, Mars, Matalan, Nestlé, Reckitt, Red Bull Racing, Sonae, Unilever, and Volkswagen about using AI to optimize virtually every facet of marketing: user attention, content creation, creative assets, CRM, customer engagement, customer insights, customer journey, data governance, personalization, product catalogs, sales leads, social media optimization, and more.
Two standout keynotes, by Nestlé's Head of Data and Marketing Analytics, Isabelle Lacarce-Paumier, and Mastercard's Fellow of Data & AI, JoAnn Stonier, focused on a critical point: AI’s success hinges on the quality of its training data. Every analyst knows that 90% of insights work is cleaning and preparing the data.
The situation couldn’t be more urgent. My longtime friend Andy Fisher, one of the few industry experts with more experience running randomized controlled experiments than I, pointed out that most companies still don't use high-quality tests to measure advertising ROI. As a result, they’re about to embed flawed campaign conclusions into AI-driven planning tools, creating a knowledge debt that could take decades to rectify.
As I’ve written here recently, most advertisers still rely on quasi-experiments at best, or decade-old attribution models at worst. Even today’s favored quasi-methods — synthetic controls, debiased ML, stratified propensity scores — offer only the illusion of experimental rigor, often delivering systematically biased results.
By contrast, randomized controlled trials, especially large-scale geo tests, remain the most reliable evidence for determining media effectiveness. Yet they’re underused and underappreciated.
Why? Because quasi-experiments are “customer pleasing,” as an MMM expert recently put it. They skew positive, so much so that Meta now mandates synthetic control methods (via its GeoTest R package) for official experimentation partners, one told me the other day, because the results are reliably favorable to Meta's media.
That might be fine if those tests stayed in the drawer as one-off vanity metrics. But with enterprise AI, they won’t. They’ll be unearthed and fed, by the dozens or hundreds, into new automated planning systems, training the next generation of tools on false signals and leading to years of misallocated media spend.
The principle is simple: garbage in, garbage out.
Saying goodbye to the Mediterranean for another year, all the Manchego and saffron bulging in my suitcase couldn't soothe my unease about the future of marketing performance. It’s time to standardize on real evidence. Randomized experiments should be the norm, not the exception, for ROAS testing. The future of AI-assisted media planning depends on it.
Gain Market Share by Disrupting Bad Ad Measurement

"It is difficult to get a man to understand something when his salary depends upon his not understanding it."
- Upton Sinclair
Do you ever get the feeling that your advertising performance metrics are mostly baloney? If so, this article is for you.
The advertising industry desperately needs brave, skeptical individuals willing to demand better evidence of what actually works—from media partners, agencies, measurement firms, and industry bodies.
But does anyone really care? Currently, over 90% of media practitioners either don't grasp the shortcomings of their current practices, have conflicting incentives, or are content with CYA reporting theater, leading to poor investment decisions.
Can you trust big tech companies like Google and Meta to tell you what's effective? After all, they've got those smarty-pants kids from MIT and Stanford, right? Surely you jest. Do you really expect them — who already receive most of your budget — to suggest you spend more on Radio, Outdoor, or Snap? Read the receipts.
What about your ad agency — isn't that their job? Actually, no. Agencies get paid based on a percentage of ad spend, so why would they ever suggest spending less? And if they're compensated on a variable rate, e.g., 15% of programmatic spend vs. 5% of linear, it's no surprise they're steering budgets toward easier and higher-margin channels.
How about your in-house analytics experts? Well, first they'd need to imply they've been measuring iROAS poorly for years. Awkward. The head of search marketing, whose budget might shrink if real measurement proved poor performance? Unlikely. The CMO? Only if she's new and ready to shake things up—your best hope for disruption.
As Upton Sinclair aptly wrote, "It is difficult to get a man to understand something when his salary depends upon his not understanding it."
We're calling on:
Private equity firms seeking hockey-stick growth
CFOs skeptical of ad metrics, viewing marketing as a cost center
Media sellers, large and small, being strangled by Google and Meta’s duopoly
Mid-tier DTC brands not yet hypnotized by synthetic control methods or captive to big tech
Today's "performance" measurement is largely flawed, built on bad signals, lazy modeling, and vanity metrics. The consequences are poor decisions, wasted budgets, and lost market share.
Avoid these unreliable measurement approaches:
Matched market testing
Synthetic control methods
Attribution models
Quasi-experiments
Black-box "optimization" solutions like PMax and Advantage+
None of these offer solid evidence. Some might be "better than nothing," but that's hardly the standard you want for multimillion-dollar decisions. At worst, they're self-serving illusions from platforms guarding their own margins, not advertiser interests.
Our profession embraces these weaker standards when better measurement is easily attainable. Marketing scientists have never met a quasi-experimental method they don't like — dense statistics are so much fun! But randomized controlled trials (RCTs) — deemed the best evidence of causality by science, with straightforward math — are falsely labeled as "too hard."
RCTs remain the only reliable method to isolate causal impact and identify true sales lift. Claims about their complexity or expense are myths perpetuated by those benefiting from the status quo.
Today's trendiest method, Synthetic Control Method (SCM), is essentially matched market testing (DMA tests familiar since the 1950s) boosted by statistical steroids. You pick DMAs to represent a test group (the first mistake) and construct a Frankenstein control from a weighted mashup of donor DMAs.
SCM excels when an RCT truly isn't possible — like assessing minimum wage impacts, gun laws, or historical political policies such as German reunification. These scenarios can't ethically or practically be randomized. But advertising? Advertising is perhaps the easiest, most benign environment for RCTs. Countless campaigns run daily, media is easily manipulated, outcomes (sales) are straightforward, quick to measure, and economically significant. There are few valid reasons not to conduct RCTs in advertising.
The first rule of holes is "Stop digging." The first rule of quasi-experiments is "Use them when RCTs are unethical or infeasible." That's almost never true for ad campaigns.
Synthetic Control Method is problematic because it:
Offers weaker causal evidence than RCTs
Is underpowered for ad measurement: the academic literature on SCM cite social policies resulting in effect sizes >10%, much greater than large marketers can expect from advertising
Lacks transparency (requires advanced statistical knowledge)
Is not easily explainable to non-statisticians
Lacks replicability (each instance is a unique snowflake dependent on many choices)
Lacks generalizability (blending 15 DMAs to mirror Pittsburgh still doesn't reflect national performance)
I've yet to hear a compelling reason for choosing SCM over RCT for ad measurement that wasn't self-interested rationalization. For more on the how, why and when to use geo RCTs, see my previous essay in this series.
As a global economic downturn looms, many advertisers will unwisely slash budgets without knowing what's genuinely effective. Don't make mistakes that could threaten your company's future. Measure properly — cluster randomized trials are your best path to true advertising ROI.