The Cost of Testing vs. the Cost of Being Wrong

Foraging vs. Farming: From careful planting come greater harvests
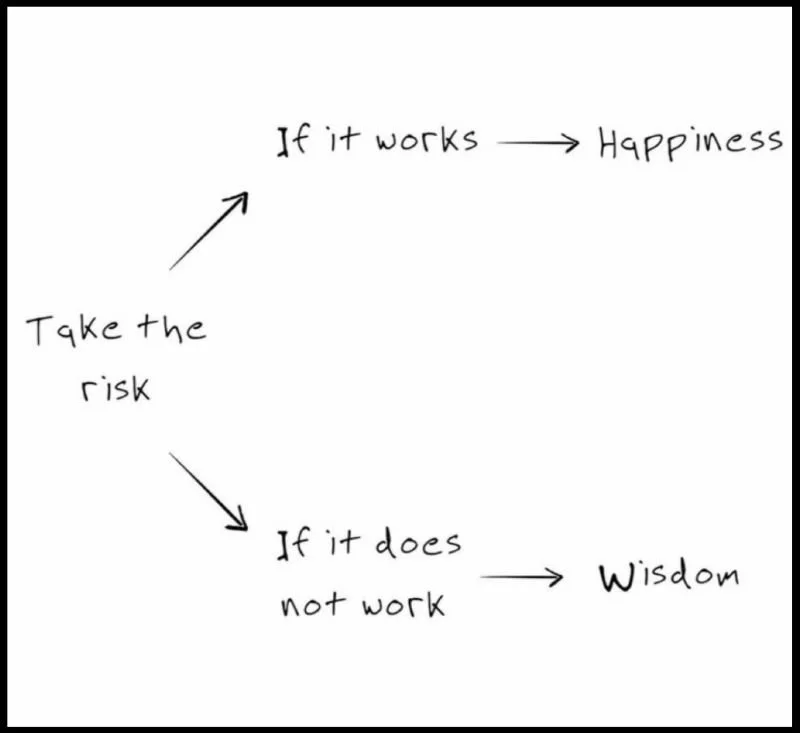
One of the most common objections to running high quality experiments for measuring advertising's impact on sales is the risk to revenue.
Geo tests, holdouts, and control groups do carry a visible cost. You deliberately withhold media from part of the market. You accept a short-term loss in exposure, and in some cases, revenue.
But that framing misses the real issue. The question is not whether you can afford to test. It is whether you can afford to keep allocating budget without knowing what is actually driving sales.
The visible cost
Testing does have a cost.
A well-designed experiment may temporarily reduce revenue in some portion of the market. For large companies, that can add up to millions of dollars in sales opportunity cost over the duration of the test.
This cost applies mainly to always-on channels such as search, social, retail media, and TV. Holding out these ads feels like stepping away from demand, even though several of these are also lower-funnel channels most prone to over-crediting conversions. For channels that are used periodically or at low levels of spend, testing typically carries little downside and may reveal incremental upside that current measurement fails to capture.
Even so, the cost is real. It is also bounded and temporary. More importantly, it is visible.
The invisible cost
What is less visible is the cost of getting the allocation wrong.
Most measurement systems that advertisers depend on today, whether last-click attribution, platform-reported lift, matched market tests, or synthetic control methods, are not direct measures of causality. They are approximations, each with their own sources of bias.
Last-click and platform reporting tend to favor bottom-of-the-funnel channels that harvest demand. Matched market and synthetic control approaches are quasi-experimental. They rely on constructing a counterfactual that is never directly observed, and the degree of error is unknowable. That makes them risky foundations for multi-million dollar decisions, especially when measuring lift sizes typical in advertising, which are often just a few percentage points.
Marketing mix models are powerful, but they depend on variation in the data, and that variation is often limited by the very budgets they are trying to evaluate. As Leslie Wood, a recipient of the ARF Erwin Ephron Demystification Award, once said to me, “People talk about Bayesian priors in their models. What they mean is last year’s budget.”
None of these methods are useless. But none are neutral.
Small biases in measurement lead to small biases in perceived performance. When those biases are applied to large budgets, the consequences are not small.
Hat tip to Avinash Kaushik
A simple example
Consider a hypothetical company with $4 billion in annual revenue and a $400 million marketing budget.
It spends $60 million on television and believes TV contributes 2 percent of sales, implying an ROI of about 1.3.
Now run a properly designed geo experiment.
As described in our whitepaper, How To Design A Geographic Randomized Controlled Trial, we advocate a design that uses all U.S. DMAs, randomized into multiple test groups that are staggered over time, a design we call Rolling Thunder. This approach provides strong statistical power and balance while limiting how much media is disrupted at any point.
More than half of geographies are included in the test, but because the groups are staggered, only a fraction of total media delivery is affected at once. In a typical setup, about 36 percent of total media exposure is impacted during the test window.
If the true effect of TV is 3 percent of sales, then only 3 percent of that 36 percent is at risk during the experiment. Spread over a seven week period, or about 13 percent of the year, the total impact is roughly 0.14 percent of annual sales.
For a $4 billion company, that is about $6 million.
That is the cost of the experiment.
Now compare that to the learning.
If the company believed TV drove 2 percent of sales but the experiment shows it is actually 3 percent, that is a $40 million difference in annual incremental revenue and an ROAS of 2.0. That upside repeats every year.
More importantly, with a better understanding of TV’s true impact, the company can reallocate more budget into television, increasing total incremental revenue further.
This example simplifies reality. It ignores diminishing returns and reach constraints. But the direction is clear. The fear of short-term loss obscures a much larger opportunity.
What experiments actually do
Experiments introduce deliberate variation.
Instead of waiting for the budget to move, they move it on purpose. Instead of inferring causality from historical patterns, they create conditions where causality can be observed directly.
This is not a replacement for modeling. It is a complement to it.
Experiments provide the signal. Models help interpret and generalize it. Without that signal, models are limited to what they have already seen.
The asymmetry
The economics are straightforward.
The cost of testing is temporary. The effect of misallocation is ongoing.
An experiment may expose millions of dollars in short-term revenue risk. But if it leads to even a modest improvement in allocation, the benefit repeats every time the budget is deployed.
Over a year, or several years, the math is not close.
The cost of testing is bounded. The cost of being wrong is not.
The real decision
Marketers often think the risk in their budgets comes from waste, or from the cost of testing.
The real risk is failing to recognize where the upside is. It is continuing to allocate based on incomplete information. And, most critically, it is being forced to cut budgets under pressure without knowing what is actually driving results.
That is how companies end up cutting the channels that are doing the most work.
No one is deciding whether to spend money on testing in isolation. They are deciding how to deploy hundreds of millions of dollars in media.
The cost of testing is easy to see. It shows up immediately in the markets you hold back.
The cost of being wrong is harder to see. It shows up quietly, in how budgets are allocated, year after year.
But it is often far larger.
You can cap the cost of an experiment. You cannot cap the cost of a bad allocation.